W1 price is located above 200 period SMA
(200-SMA) and above 100 period SMA (100-SMA) for the primary bullish market condition:
- Fibo resistance level at 1.3213 is going to be broken for the bullish trend to be continuing.
- Next bullish target is R3 Pivot at 1.3352.
- "Near-term resistance is at 1.3232, the 38.2% Fibonacci expansion, with a break above that on a daily closing basis exposing the 50% level at 1.3347."
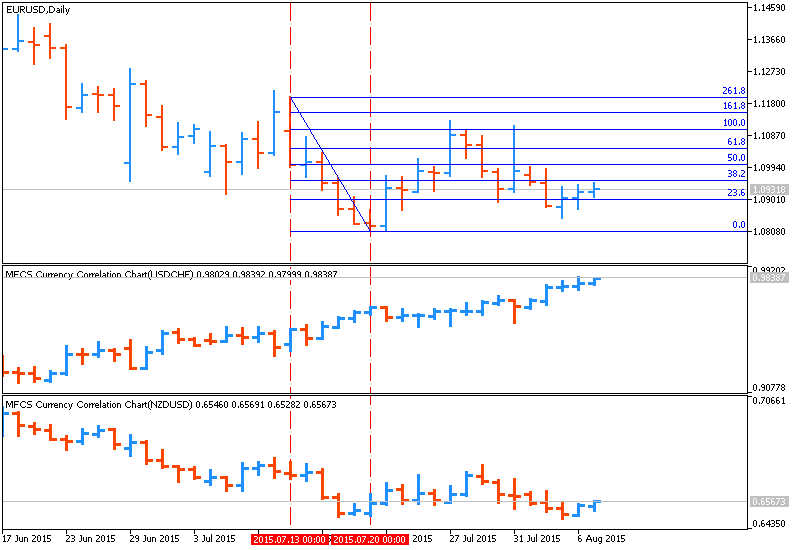
- "Alternatively, a turn below the 23.6% expansion at 1.3090 clears the way for a test of the 14.6% expansion at 1.3002."

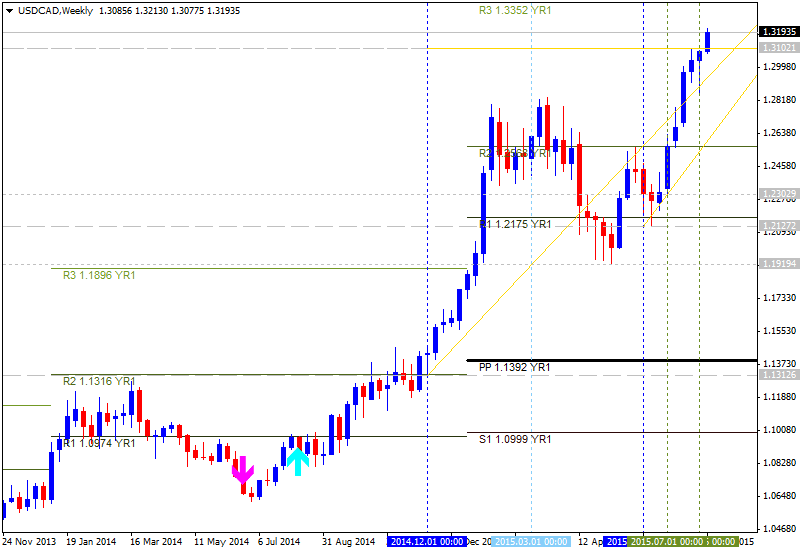
If the price will break Fibo resistance level at 1.3213
so the bullish trend will be continuing with the secondary ranging condition.
If the price will break R3 Pivot at 1.3352
so the price will come to the bullish area of the chart with good breakout possibilities.
If not so the price will be ranging between the levels.
Trend: