Technical Analysis for US Dollar, S&P 500, Gold and Crude Oil - Breaks 2-Month Support for S&P 500
8 June 2015, 06:11

1
699
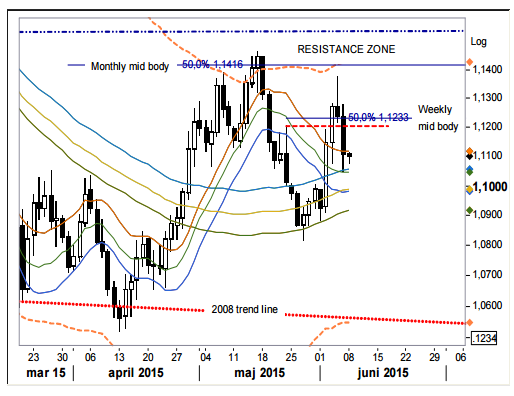
US DOLLAR TECHNICAL ANALYSIS
Prices found interim support and mounted a cautious recovery after declining to a two-week low. A daily close below the 38.2% Fibonacci retracement at 11887 exposes the 50% level at 11839. Alternatively, a rebound above the 14.6% Fib expansion at 11922 clears the way for a test of the 23.6% threshold at 11959.
S&P 500 TECHNICAL ANALYSIS
Prices broke below two-month trend support to challenge the 38.2% Fibonacci retracement squarely at the 2100.00 figure. A break below this barrier exposes the 50% level at 2088.60.
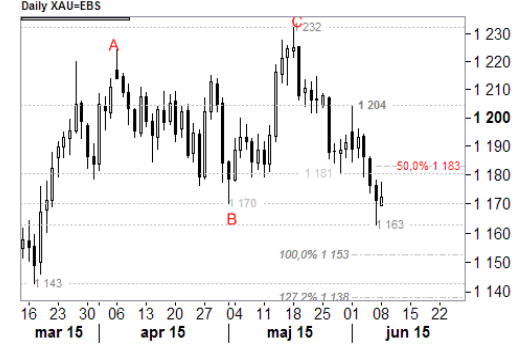
GOLD TECHNICAL ANALYSIS
Prices broke downward out of consolidation, aiming to challenge support at 1171.98 marked by the 61.8% Fibonacci expansion. A break below that exposes the 76.4% level at 1164.36. Alternatively, a reversal back above the 50% Fib at 1178.14 targets the 38.2% expansion at 1184.30.
CRUDE OIL TECHNICAL ANALYSIS
Prices found interim support and mounted a cautious recovery after declining to a two-week low. A daily close below the 38.2% Fibonacci retracement at 11887 exposes the 50% level at 11839. Alternatively, a rebound above the 14.6% Fib expansion at 11922 clears the way for a test of the 23.6% threshold at 11959.
S&P 500 TECHNICAL ANALYSIS
Prices broke below two-month trend support to challenge the 38.2% Fibonacci retracement squarely at the 2100.00 figure. A break below this barrier exposes the 50% level at 2088.60.

GOLD TECHNICAL ANALYSIS
Prices broke downward out of consolidation, aiming to challenge support at 1171.98 marked by the 61.8% Fibonacci expansion. A break below that exposes the 76.4% level at 1164.36. Alternatively, a reversal back above the 50% Fib at 1178.14 targets the 38.2% expansion at 1184.30.

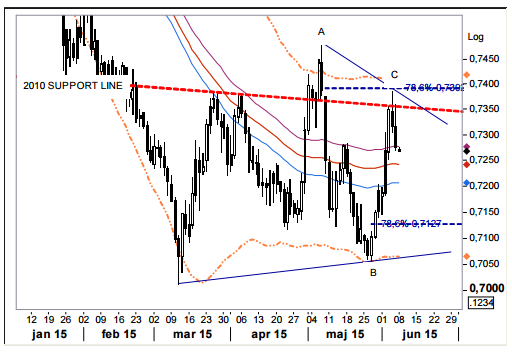
CRUDE OIL TECHNICAL ANALYSIS
Prices narrowly edged past support guiding the uptrend since mid-January. Sellers now aim to challenge the 38.2% Fibonacci retracement at 60.27, with a break below that exposing the 50% level at 57.39. Alternatively, a move back above the trend line – now recast as resistance at 62.32 – targets a downward-sloping barrier at 65.57.