- What has already happened in the economy based on past numbers (referred to as a lagging indicator)
- What is anticipated going forward based on past numbers. (referred to as a leading indicator)
- What is happening right now based on current data. (referred to as a coincident indicator)
Economic indicators are designed to try and give a picture of the growth the economy is experiencing, the level of price increases or inflation that the economy is experiencing, or both.
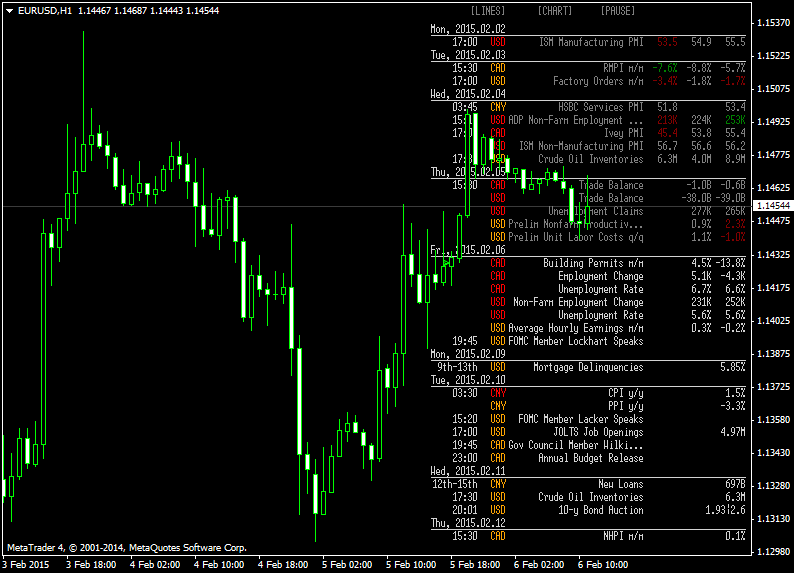
One of the most important and therefore market moving economic numbers
after GDP is the Non Farm Payrolls (NFP), which is released at 8:30 am
on the first Friday of each month. Released by the Bureau of Labor
Statistics the Non Farm Payrolls Number is meant to represent the number
of jobs added or lost in the economy over the last month, not including
jobs relating to the Farming industry. The Farming Industry is not
included because of its seasonal hiring which would distort the number
around harvest times as farms add workers and then release them after
the harvest is complete for example.
As with GDP, there is a huge amount of data published along with this
report, all of which you can see on the Bureau of Labor Statistics
websiteю
In general increases in employment means businesses are hiring which
means they are growing and also that more people are employed so more
people have money to spend on goods and services further fueling growth.
The opposite of this is obviously true for decreases in employment.
While the overall number of jobs added or lost in the economy is
obviously an important current indicator of what the economic situation
is, the report also includes several other pieces of data which can move
the markets:
1. What the unemployment rate is in the economy as a percentage of the overall workforce.
This
is an important part of the report as the amount of people out of work
is a good indication of the overall health of the economy, and this is a
number that is watched by the Fed as when it becomes too low (generally
anything below 5%) inflation is expected to start to creep up as
businesses have to pay up to hire good workers and increase prices as a
result.
2. What sectors the increase or decrease in jobs came from.
This can give traders a heads up on which sectors of the economy may be
primed for growth as companies in those sectors such as housing add
jobs.
3. Average Hourly Earnings.
This is an important component
because if the same amount of people are employed but are earning more
or less money for that work, this has basically the same effect as if
people had been added or subtracted from the labor force.
4. Revisions of previous non farm payrolls releases. An
important component of the report which can move markets as traders
re-price growth expectations based on the revision to the previous
number.