당사 팬 페이지에 가입하십시오
Collect All Indicators Script
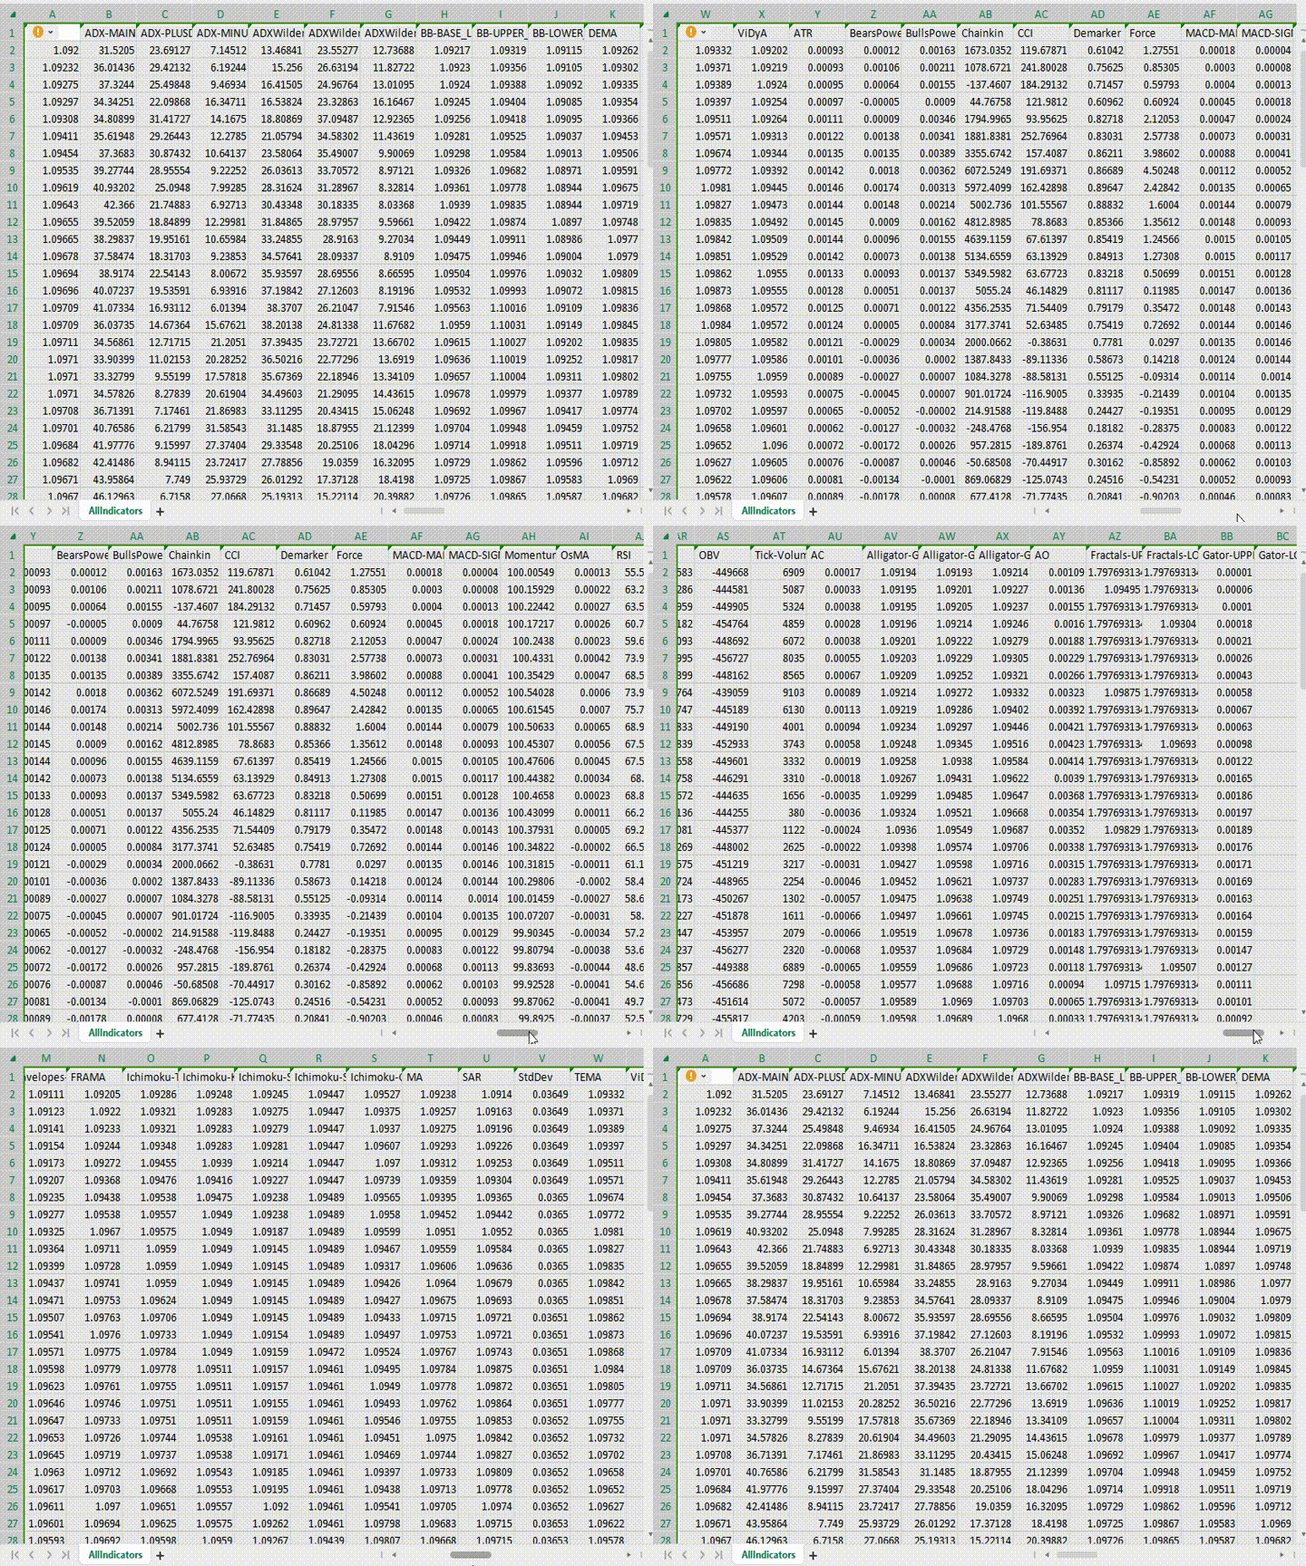
This Script collects all MQL5 built-in indicators buffers and stores them in a CSV file for analysis purposes.

Bollinger Bands (BB):
- BB_BASE_LINE: The base (central) line of the Bollinger Bands.
- BB_UPPER_BAND: The upper band of the Bollinger Bands.
- BB_LOWER_BAND: The lower band of the Bollinger Bands.
Other Indicators:
- ADX-MAIN_LINE: The main line of the Average Directional Movement Index (ADX).
- ADX-PLUSDI_LINE: The line representing the Positive Directional Movement in ADX.
- ADX-MINUSDI_LINE: The line representing the Negative Directional Movement in ADX.
General Indicators:
- DEMA: Double Exponential Moving Average.
- FRAMA: Fractal Adaptive Moving Average.
- MA: Moving Average.
- SAR: Parabolic SAR.
- StdDev: Standard Deviation.
- TEMA: Tripple Exponential Moving Average.
- ViDyA: Variable Index Dynamic Average.
Oscillators:
- ATR: Average True Range.
- BearsPower: Bears Power.
- BullsPower: Bulls Power.
- Chainkin: Chainkin Oscillator.
- CCI: Commodity Channel Index.
- Demarker: DeMarker.
- Force: Force Index.
- MACD-MAIN_LINE: The main line of the Moving Average Convergence Divergence (MACD).
- MACD-SIGNAL_LINE: The signal line of MACD.
- Momentum: Momentum.
- OsMA: Oscillator of Moving Average (derived from MACD).
- RSI: Relative Strength Index.
- RVI-MAIN_LINE: The main line of Relative Vigor Index (RVI).
- RVI-SIGNAL_LINE: The signal line of RVI.
- Stochastic-MAIN_LINE: The main line of the Stochastic Oscillator.
- Stochastic-SIGNAL_LINE: The signal line of Stochastic Oscillator.
- WPR: Williams' Percent Range.
Volumes:
- AD: Accumulator Distributor.
- MFI: Money Flow Index.
- OBV: On Balance Volume.
- Tick-Volumes: Tick Volumes.
Bill Williams:
- AC: Accelerator Oscillator.
- Alligator-GATORJAW_LINE: The Jaw line of the Alligator indicator.
- Alligator-GATORTEETH_LINE: The Teeth line of Alligator.
- Alligator-GATORLIPS_LINE: The Lips line of Alligator.
- AO: Awesome Oscillator.
- Fractals-UPPER_LINE: The upper line of Fractals.
- Fractals-LOWER_LINE: The lower line of Fractals.
- Gator-UPPER_HISTOGRAM: The upper histogram of Gator Oscillator.
- Gator-LOWER_HISTOGRAM: The lower histogram of Gator Oscillator.
- BWMFI: Bill Williams Market Facilitation Index.
Numerical Values:
The numerical values in the dataset represent the calculated values for each corresponding indicator. These values could include prices, percentages, or other quantitative measures depending on the indicator.
Usage:
The dataset is suitable for various financial analyses and machine learning tasks. It allows you to explore the behavior of different indicators across various financial instruments and timeframes. You can use these features to develop models for predicting market trends, identifying trading signals, or gaining insights into market dynamics.
 Linear Regression calculation based on pine script v4
This is the exact conversion of linreg function from pine script v4 as an mql5 indicator.
 Candle ZigZag
Candle ZigZag is an indicator which changes its leg if a candlestick color changes
 Volume Profile
This is an indicator for showing volume profile on the chart, using simple calculations and very fast execution.
 Cosine distance and cosine similarity
Calculate the cosine distance and similarity between 2 vectors . The cosine distance is 1-cosine_similarity and the cosine similarity is the dot product of two vectors by their magnitudes multiplied.
