Ahmad Waddah Attar / 販売者
パブリッシュされたプロダクト
Waddah Attar Binary Support and Resistance Indicator. This indicator draws on chart very powerful Support and Resistance levels. It calculate these levels based on price binary values. Stronger levels are drawn in Blue Color and Red Color in more width. You can change the color and width for these levels from the indicator properties window. This indicator works only on five-digit symbols.
FREE
Most of brokers make slippage for your orders (stop orders or market orders). When you make limit orders (Buy or Sell), they don't make slippage for you. Because it is for your advantage. This EA will resolve limit slippage problem for you with any brokers. Slippage Problem Example: The price now is 1.31450, you put sell limit at 1.31500. If the price jumps to 1.31550. The Broker will execute your sell limit at 1.31500 NOT 1.31550. If you put buy stop, the Broker will execute it at 1.31550 (or m
FREE
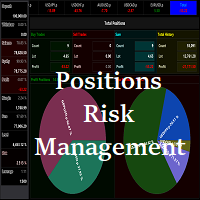
Waddah Attar Easy Positions Risk Management
This EA gives you a full ability to close one position or close all positions . Close buy or sell trades in any position . Close profit or loss position . by clicking on a command button on the chart with confirmation message . Show you a full information about your positions like : count - lots - average price - points - profit - profit % - used margin for this position and the risk percent . and also the scrolled table of trades that position ha
FREE
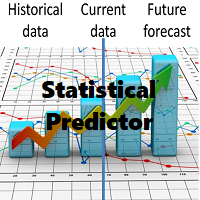
Waddah Attar Statistical Predictor
This indicator show you the Statistical Forecast for any symbol. it depends on a history data . the result show on a new day and still with no change until end of the day . with this indicator you can : know the main direction . know the range of the movement . know high and low in the current day . use indicator levels in any expert you made to auto trade .
Preferably used with main symbols like EURUSD, GBPUSD, AUDUSD, NZDUSD, USDJPY, USDCHF, USDCAD, Gold,
FREE
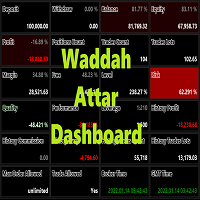
Waddah Attar Dashboard
Simple App show you the most important information about your account , trades and history . Risk , Quality and Performance are the most important numbers you must watch them carefully . also the important thing you must do is Focus on the RED Color on the board . you can control the font name , font size , width , height and padding properties . the information is auto arranged on the chart . don't worry about it .
Thanks .
recommended product for position risk man
FREE

Waddah Attar Mini Close Graphical Panel EA .
This EA does not Trade with built in Strategy .
It is shows you your orders information in a table mode . You can close any group of your orders with mouse click . The table contain : Type : Buy + : means all buy profit orders . Buy - : means all buy loss orders . Sum : means all buy orders .
Sell + : means all sell profit orders . Sell - : means all sell loss orders . Sum : means all sell orders .
Total : means all orders . North : means a
FREE

Waddah Attar Fastest Close All.
This utility will Close all your orders in fastest possible way.
say you have 100 EURUSD , 75 GBPUSD and 120 USDJPY orders ... and you decide to close all of them .
the expert will make hedge to all thats orders in three orders only .. one to eurusd and one to usdjpy and one to gbpusd .
then close this 100% hedge of your all orders by CloseBy method.
you can set ProfitDollar (more than zero) and LossDollar (less than zero) proprties to auto close all o
FREE
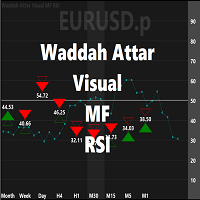
Waddah Attar Visual MF RSI
this App show you RSI values and status for all frames in one chart .
Filled Triangle means current RSI Value . Framed Triangle means previous RSI Value . Up Arrow and Green Color means the direction of RSI is up . Down Arrow and Red Color means the direction of RSI is down .
when you move mouse cursor on frame column .. the full RSI chart will drawn .
you can change RSI Period in the app properties .. the default is 14 .
thanks and good luck .
FREE
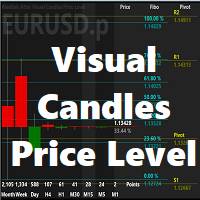
Waddah Attar Visual Candles Price Level
This utility shows you the last candle of every time frame in same scale . and show you the levels of fibo and pivot for this candles according to the big time frame . you can set then first big time frame by change time period for the chart .
the main benefits for this utility is you can see all last candles on the same drawing scale . and know where is the current price movements and directions area .
Thanks .
FREE