私たちのファンページに参加してください
- ビュー:
- 85262
- 評価:
- パブリッシュ済み:
- 2019.05.24 10:32
-
 取引の機会を逃しています。
- 無料取引アプリ
- 8千を超えるシグナルをコピー
- 金融ニュースで金融マーケットを探索
-
 このコードに基づいたロボットまたはインジケーターが必要なら、フリーランスでご注文ください
フリーランスに移動
このコードに基づいたロボットまたはインジケーターが必要なら、フリーランスでご注文ください
フリーランスに移動
By definition :
By Alan Hull
Back in 2005 when I was working on a new indicator I was temporarily sidetracked by trying to solve the problem of lag in moving averages, the outcome of which was the Hull Moving Average.
Since then the HMA has found its way into charting programs around the world and is regularly discussed on traders bulletin boards in different languages around the world. It was the result of an intellectual curiosity which I placed into the public domain by writing the following article Alan Hul Hull Moving Average.
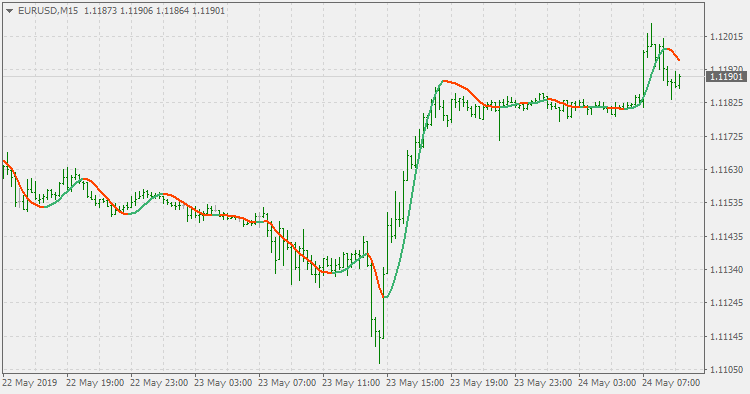
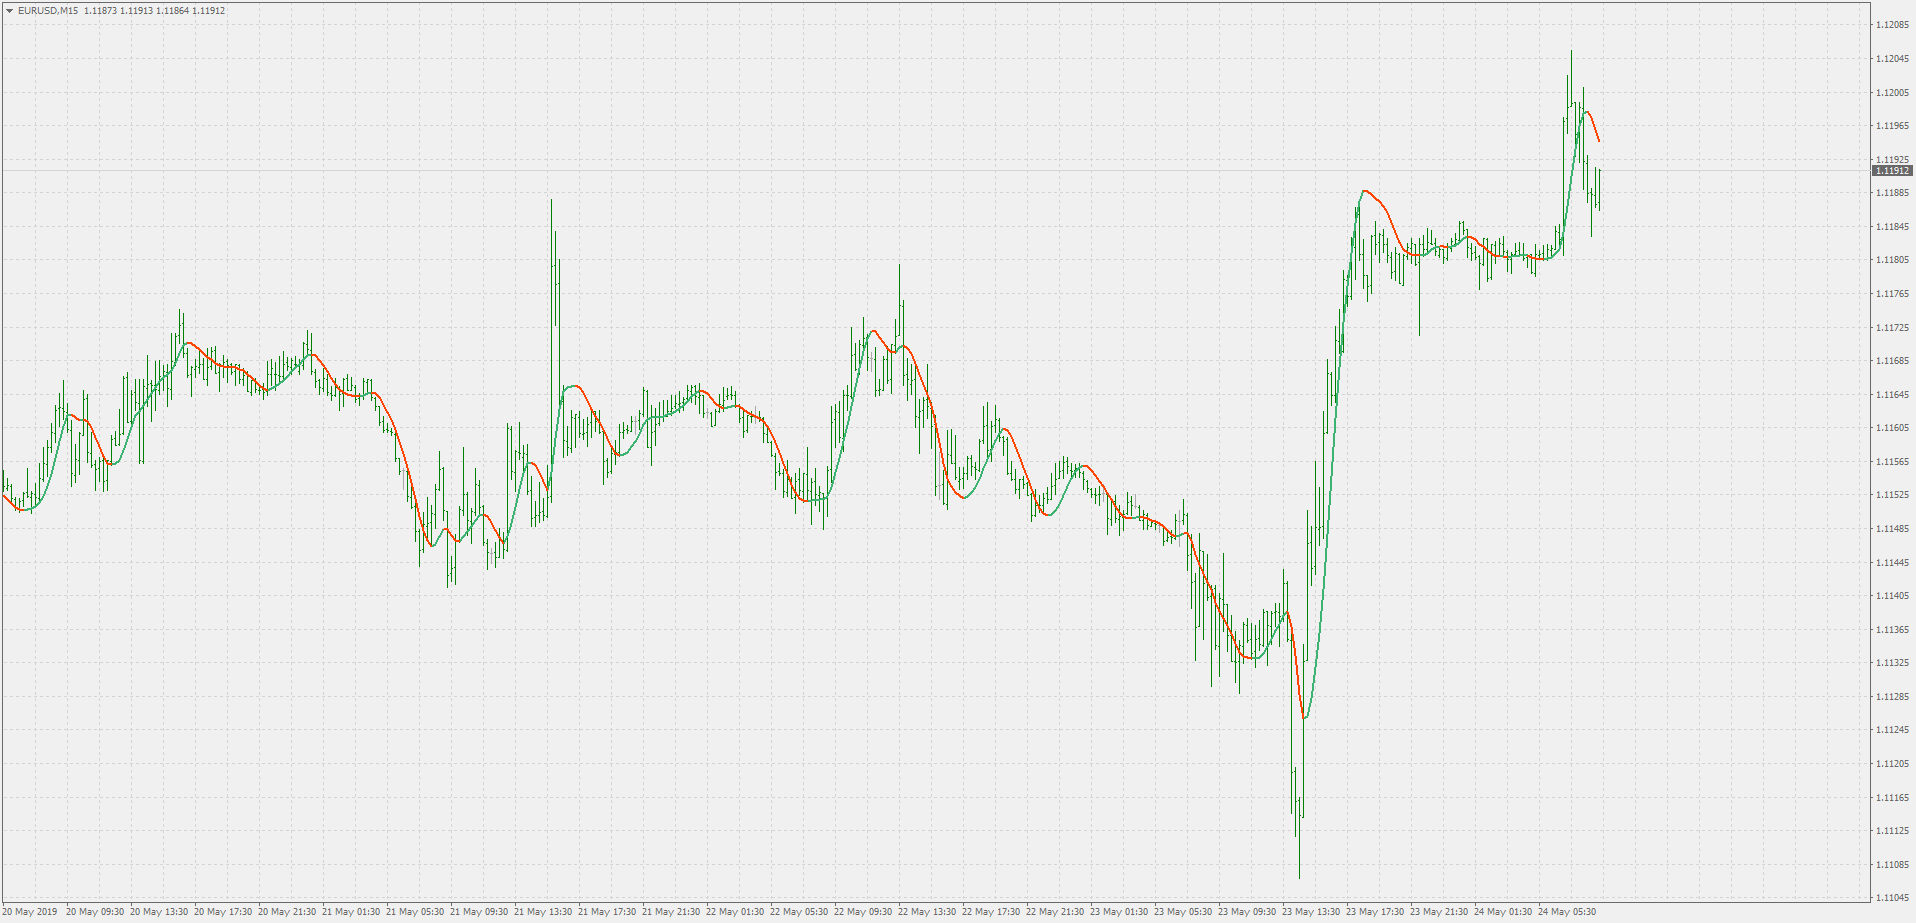
The Hull Moving Average solves the age old dilemma of making a moving average more responsive to current price activity whilst maintaining curve smoothness. In fact the HMA almost eliminates lag altogether and manages to improve smoothing at the same time.
To understand how it achieves both of these opposing outcomes simultaneously we need to start with an easily understood frame of reference. The following chart contains a 16 week simple moving average which constantly lags the price activity and has poor smoothness.
Hull Moving Average (HMA) formula
Integer(SquareRoot(Period)) WMA [2 x Integer(Period/2) WMA(Price) - Period WMA(Price)]
There are multiple reasons for posting this indicator into metatrader 4 code base :
- the eternal "need for speed" cause : Hull average is (regardless how it is calculated) a CPU intensive calculation. This version is solving that by avoiding loops where they usually are used
- this version is the variation that allows you to specify the "speed" of the Hull average and thus to adjust the Hull (that tends to be overshooting in its original form) to our needs
- there are countless versions of Hull average, using countless names, that are showing the two colored line - and a lot of them are repainting. This one is a non-repainting version
 iTRADE
Do you rely on your analysis and just want help on position sizing and how and when to take profit ? Do you have a lot of open positions and you need to reduse your DD and release some margin?
 Remove Equity from Demo Account
Quick scripts to remove Equity from a demo account for a broker that does not support anyway to withdraw.
 Basket Viewer-View Statistics on groups of Long and Short Pairs
User may enter up to 50 symbols from their market watch in either a long or short basket for viewing. The symbols for the chart can be changed to any symbol in the display with a click on the symbol. Statistics including ATR for the chart period, points gained or lost from a weeks start and position gains or losses and lots exposure are displayed. The statistics week may be changed with simple clicks on the display, and the display may be dragged and dropped to different locations. The load on quote processing is kept low by simply posting an event that starts the processing for a display update.
Variance V2
Variance (Welford’s method for computing)