Watch the Market tutorial videos on YouTube
How to buy а trading robot or an indicator
Run your EA on
virtual hosting
virtual hosting
Test аn indicator/trading robot before buying
Want to earn in the Market?
How to present a product for a sell-through
New Expert Advisors and Indicators for MetaTrader 5 - 21

HighDaily
The Expert Advisor has been developed for EURUSD H1 based on HighDaily, ATR, and pending orders. It has been backtested on over 20 years of tick data with a modeling quality of 99%. The attached screenshots feature the robustness test through Monte Carlo analysis with 1000 simulations. We recommend using a broker with low spreads and slippage for better performance. There is no need to set up any parameters; these settings are optimized. There is no need to use a large account. We rec
FREE

Holeshot MT5 is a highly effective reversion trading system that leverages the power of momentum, and custom trend indicators to detect high-probability trading opportunities U-Turn areas to exploit. When demoing the system use this link below to get sample set files for your account size:
Holeshot MT5 Demo Set Files
Launch Sales The Launch Sale is $250, the first 10 believers in this product would receive this outstanding EA at our launch price. ***Buy Holeshot MT5 and you could get the P

HAshi-E is an enhanced way to analyze Heiken-Ashi signals.
Briefing:
Heiken-Ashi is particularly valued for its ability to filter out short-term volatility, making it a preferred tool for identifying and following trends, helps in decision-making regarding entry and exit points, and assists in distinguishing between false signals and genuine trend reversals. Unlike traditional candlestick charts, Heiken-Ashi candles are calculated using average values of previous bars, creating a smoother,

Spike Hunter has been developed for Crash and boom markets.
Spike Hunter does not repaint.
Also please download SPIKE HUNTER(B)-boom and SPIKE HUNTER(B)-crash from the comments section to assist with extra confirmation Buy Signal ; Make sure that the trend for boom is Uptrend on 15 and 30min. Use the SPIKE HUNTER(B)-boom on your chart. Once the Up arrow comes on and the SPIKE HUNTER(B)-boom line color is blue then its the best time to trade. Sell Signal ; Make sure that the trend for crash

On-Balance Volume (OBV) is a technical indicator that relates volume and price to identify price movements. The basic idea behind OBV is that changes in volume generally precede price changes. The indicator accumulates volumes for periods when the price closes higher and subtracts volumes for periods when the price closes lower. This results in a value used to identify the direction of the asset's trend.
The interpretation of the OBV is simple: a rising OBV suggests that buyers are willing to

In the realm of technical analysis, ParbMA emerges as a highly intuitive tool for examining the Parabolic SAR trend . This innovative approach leverages a customizable line, distinguished by its versatility in color, shape, and width options. Such flexibility enhances visual analysis and significantly aids in strategizing and decision-making.
The ParbMA (Parabolic Moving Average) is a custom technical indicator that combines the concepts of J. Welles Wilder's Parabolic SAR (Stop and Reverse)

Functional in the Forex market. Functional on the B3 market - Bolsa Brasil Balcão. Motivation The Price Guide indicator is a tool that helps you insert support and resistance points at the chosen price and in the quantity you want, it depends on the agility of its configuration. This FULL version will work in Meta Trader 5 on all accounts and Strategy Tester . To test on the DEMO account , download the free version at: https://www.mql5.com/pt/market/product/111620 Operation The method

Designed by Welles Wilder for daily commodity charts, the ADXW is now used in various markets by technical traders to assess the strength of a trend or even a trend for short- or long-term trades.
The ADXW uses a positive (DI+) and negative (DI-) directional indicator in addition to its trend line (ADX).
According to Wilder, a trend has strength when the ADX signal is above 25; the trend is weak (or the price has no trend) when the ADX is below 20. The absence of a trend does not mean that
GOLD ESCAVATOR TRADING BOT A trading bot for XAUUSD. Lot size is calculated by multiplying the lot factor by each 100 USD on account. NB: These are risky strategies which give good returns over time but also pose a risk of blowing up your account. Use on your own accord. LINKS Automatic Pattern and Trendline Analyst : https://www.mql5.com/en/market/product/88794 Automatic Price Action Level Plotter: https://www.mql5.com/en/market/product/94338 MQL5 SIMPLIFIED SUMMARY; learn how to code your
FREE

BreakHarmony Multi-Timeframe Breakout Indicator for MT5
The BreakHarmony Multi-Timeframe Breakout Indicator for MT5 is a highly advanced tool providing information on breakout points across different timeframes, aiding traders in decision-making and understanding market movements. [ Features and Manual | MT4 version | All Products ] The indicator tracks breakout points on price charts across 6 timeframes. Breakout prices are indicated with the closing price of the correspond
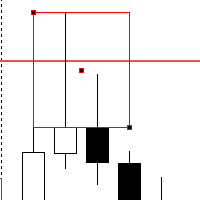
Introducing our Rejection Block Scanner – a powerful and intuitive tool designed to revolutionize your trading by effortlessly identifying key rejection zones across various timeframes. This cutting-edge scanner is crafted to cater to both beginner and experienced traders, offering unparalleled insights into potential market turning points.
**Key Features:**
1. **Multi-Timeframe Analysis:** Uncover opportunities on a grand scale! Our Rejection Block Scanner meticulously scans multiple timef
FREE

Send signals to your Discord channel in a simple way. Enjoy.
All instructions on YouTube video, this don't need a large description.
I add unnecessary text that Metatrader asks me for:
Once upon a time, in a quaint little village, there lived a curious and adventurous young girl named Lily. Lily had big, bright eyes that sparkled with excitement, and she loved exploring the enchanted forest that bordered her home.
One sunny morning, Lily decided to embark on a special advent
FREE

Functional in the Forex market. Functional on the B3 market - Bolsa Brasil Balcão. Motivation The Price Guide indicator is a tool that helps you insert support and resistance points at the chosen price and in the quantity you want, it depends on the agility of its configuration. This DEMO version will work on the Meta Trader 5 Demo account and Strategy Tester. Get the Full version that works with a Real account click: https://www.mql5.com/pt/market/product/111897 Operation The methodology publi
FREE
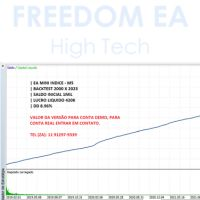
Looking to boost your financial market results?
The EA Mini Index is the answer. Tested and enhanced since 2000, this expert advisor offers operations on the M5 chart, with an initial balance of R$ 1,000 and an impressive net profit of R$ 420,000 until 2023, maintaining a drawdown of only 8.96%.
Seize this unique opportunity to increase your profitability and operate more effectively.

Introducing UJ Master EA, a simple yet powerful Expert Advisor for trading the USDJPY pair! Developed, tested and traded by a team of experienced traders with trading experience of over two decades. Prop-Firms Ready Easy To Set up Not sensitive to broker conditions UJ Master EA is updated every 3 months to get the best results!
UJ Master EA utilizes a complex price action strategy and smart money concepts, following strict mechanical rules. For the best possible results, follow these st

An indicator to show the current U.S. Dollar Index ( USDX , DXY , DX ). It is a weighted geometric mean of the dollar's value relative to the following select currencies: Euro (EUR), 57.6% weight. Japanese yen (JPY) 13.6% weight. Pound sterling (GBP), 11.9% weight. Canadian dollar (CAD), 9.1% weight. Swedish krona (SEK), 4.2% weight. Swiss franc (CHF) 3.6% weight.
You can request me to customize a similar indicator with weighted and currency pairs you desire. Just call me on MQL5, thank

O Touch VWAP é um indicador que permite calcular uma Média Ponderada por Volume (VWAP) apenas apertando a tecla 'w' no seu teclado e após clicando no candle do qual deseja realizar o calculo, clicando abaixo do candle é calculada a VWAP baseado na minima dos preços com o volume, clicando sobre o corpo do candle é calculado uma VWAP sobre o preço medio com o volume e clicando acima do candle é calculado uma VWAP baseado na máxima dos preços com o volume, voce tambem tem a opção de remover a VWA
FREE

Grid Engulfing MT5 is designed with a engulfing candle for entry points.
Please give me 5 stars reviews, than I will be maintain & update this free EA for longtime or all of time. I am promise.
Recommendations: Currency pair: ALL PAIR CURRENCIES Timeframe: M5 Minimum deposit currencies : $250 ($500 recommended) Account type: Raw or zero spread accounts IMPORTANT: It is very important to use LOW SPREAD accounts for best results !
setfiles allcurrencies (best pair : EURUSD, EURGBP, EURCAD
FREE

Introducing the Accelerator Divergence Indicator, a powerful tool designed to enhance your Forex trading experience. This innovative indicator is specifically crafted to identify market divergence, providing traders with valuable insights for more informed decision-making. The Accelerator Divergence Indicator utilizes advanced algorithms to detect divergence in the market, visually guiding traders with precision-drawn lines that highlight key points of interest. Divergence occurs when the price
FREE

What is this indicator? This indicator is the MACD (Moving Average Convergence/Divergence) supporting Virtual Trading mode of Knots Compositor . When the mode is turned on, the indicator will be recalculated based on the displayed candlesticks. When the mode is turned off, the indicator will be recalculated based on the original chart candlesticks.
Types of the applied price - Close - Open - High - Low - Median Price (HL/2) - Typical Price (HLC/3) - Weighted Price (HLCC/4)
KC-Indicators
FREE

Stat Monitor is a good information indicator.
Benefits of the indicator: The indicator provides useful information - the current spread, the cost of one lot of the symbol, trading leverage and the recommended lot size for trading. You can use the indicator on the MetaTrader 5 trading platform of any broker. The indicator provides useful information.
Version of the Stat Monitor indicator for MetaTrader 4 I wish you all good luck in trading and stable profit!
FREE

What is this script?
This script deletes all objects on all charts at once. You can delete all objects on all charts at once by running the script and allowing in the message box. This script is also a plugin of MT5's FX verification software " Knots Compositor ".
How to use
1. Run the script. 2. Allow it in the message box. 3. All objects will be deleted on all charts.
FREE

The Adaptive Market Navigator(AMN) EA is an automated trend-based trading advisor combining the advantages of ATR, Bears Power and Moving Average indicators. The used strategy is well suited for both beginners and experienced traders.
The minimum deposit is $100 for a 1:100 leverage.
I recommend to use a 1:100 ECN account with a low spread and a fast VPS.
Optimized for EURUSD pair on 1H timeframe.
Due to the simplicity and convenience of this EA every user can give it a try and choose t

What is this indicator? This indicator is the Stochastic Oscillator supporting Virtual Trading mode of Knots Compositor . When the mode is turned on, the indicator will be recalculated based on the displayed candlesticks. When the mode is turned off, the indicator will be recalculated based on the original chart candlesticks.
KC-Indicators - KC-MA (Moving Average) - KC-ENV (Envelopes) - KC-BB (Bollinger Bands) - KC-ADX (Average Directional Movement Index) - KC-MACD (Mo
FREE

What is this indicator? This indicator is the ADX (Average Directional Movement Index) supporting Virtual Trading mode of Knots Compositor . When the mode is turned on, the indicator will be recalculated based on the displayed candlesticks. When the mode is turned off, the indicator will be recalculated based on the original chart candlesticks.
KC-Indicators - KC-MA (Moving Average) - KC-ENV (Envelopes) - KC-BB (Bollinger Bands) - KC-ADX (Average Directional Movement Index)
FREE

What is this indicator?
This indicator is the Moving Average supporting Virtual Trading mode of Knots Compositor . When the mode is turned on, the indicator will be recalculated based on the displayed candlesticks. When the mode is turned off, the indicator will be recalculated based on the original chart candlesticks.
Types of the moving average - Simple (SMA) - Exponential (EMA) - Smoothed (SMMA) - Linear weighted (LWMA)
Types of the applied price - Close - Open - High - Low - Media
FREE

What is this indicator? This indicator is the RSI (Relative Strength Index) supporting Virtual Trading mode of Knots Compositor . When the mode is turned on, the indicator will be recalculated based on the displayed candlesticks. When the mode is turned off, the indicator will be recalculated based on the original chart candlesticks.
Types of the applied price - Close - Open - High - Low - Median Price (HL/2) - Typical Price (HLC/3) - Weighted Price (HLCC/4)
KC-Indicators - KC-MA (M
FREE

What is this indicator?
This indicator is the Envelopes supporting Virtual Trading mode of Knots Compositor . When the mode is turned on, the indicator will be recalculated based on the displayed candlesticks. When the mode is turned off, the indicator will be recalculated based on the original chart candlesticks.
Types of the moving average - Simple (SMA) - Exponential (EMA) - Smoothed (SMMA) - Linear weighted (LWMA)
Types of the applied price - Close - Open - High - Low - Median Pri
FREE

What is this indicator?
This indicator is the Bollinger Bands supporting Virtual Trading mode of Knots Compositor . When the mode is turned on, the indicator will be recalculated based on the displayed candlesticks. When the mode is turned off, the indicator will be recalculated based on the original chart candlesticks.
Types of the applied price - Close - Open - High - Low - Median Price (HL/2) - Typical Price (HLC/3) - Weighted Price (HLCC/4)
KC-Indicators - KC-MA (Moving Averag
FREE

Flat è una utility pensata per chi ama operare con take profit e stop loss virtuali ed ordini di copertura come sistema di protezione del capitale, ma a volte ad esempio la notte non è possibile operare quindi si è costretti ad intervenire nel momento e nel modo sbagliato Facciamo un esempio, dopo aver ricevuto un segnale ti posizioni sul mercato con una posizione Long ma il mercato a bassi volumi e comprendi che il tuo posizionamento è valido ma bisogna attendere più di quanto pensavi fosse ne

Profit X invia notifiche sul tuo dispositivo mobile mantenendoti aggiornato sul profitto dei tuoi investimenti anche nei momenti in cui non puoi fisicamente controllare i mercati, ad esempio quando sei alla guida, sul posto di lavoro, in una riunione o con amici, con parenti e non puoi distrarti Può essere disattivata e attivata ed è possibile scegliere la frequenza del aggiornamenti in minuti, ore, giorni, settimanale o mensile La configurazione e personalizzazione è molto semplice, di default

**MT5** Elevate your risk management game with Equity Savior, the go-to Expert Advisor designed to safeguard your equity during prop firm challenges. This powerful yet user-friendly tool lets you choose your preferred trading session, set a maximum lot size, and establish a daily trade limit effortlessly. Key Features: Session Selection: Tailor your trading approach by selecting specific sessions, aligning with your strategy and prop firm challenge requirements. Max Lot Size Control: Take co

The Piercing candlestick pattern is formed by two candles. Here’s how to identify the Piercing candlestick pattern: The first candle must be bearish The second candle must be bullish The open level of the second candle must be below the first candle (there’s a gap there) The close of the second candle must be above the 50% level of the body of the first candle This 2-candle bullish candlestick pattern is a reversal pattern, meaning that it’s used to find bottoms. For this reason, we want to

The White Marubozu candlestick pattern is formed by one single candle. Here’s how to identify the White Marubozu candlestick pattern: One single bullish candle The body must be big The wicks should be small or non-existent This 1-candle bullish candlestick pattern is a reversal pattern, meaning that it’s used to find bottoms. For this reason, we want to see this pattern after a move to the downside, showing that bulls are starting to take control. When a White Marubozu candlestick pattern a

The Dragonfly Doji candlestick pattern is formed by one single candle. Here’s how to identify the Dragonfly Doji candlestick pattern: The candle has no body The wick at the bottom must be big At the top, it should have no wick, or be very small This 1-candle bullish candlestick pattern is a reversal pattern, meaning that it’s used to find bottoms. For this reason, we want to see this pattern after a move to the downside, showing that bulls are starting to take control. When a Dragonfly Doji can

A simple and reliable advisor for Gold XAUUSD . MT5 Can be set to any timeframe. The advisor uses several features of Gold trading: - when the strategy is simpler, the more reliable it is; - the best deals on Gold are made only in Buy; - the best deals on Gold are made only on Fridays.
Trading is carried out only with a fixed lot. The advisor will be an excellent addition to your trading portfolio strategies.
The advisor can withstand large slippages and large spread widening, whi

Position Manager serves as an expert advisor (EA) designed to enhance your trading experience by providing a user-friendly panel for intuitive management of your positions. This tool empowers you with a seamless interface, allowing for efficient handling of trades and improved control over your trading positions. The primary objective of Position Manager is to simplify and streamline the management of your positions, enabling you to make informed decisions with ease. Through its intuitive design

Limited Time Offer! Only $ 5300 USD ! The price will increase by $100 USD after every 10th purchase ! Final price: $ 15 000 USD DESCRIPTION : Attention! Contact me immediately after purchase to receive setup instructions!
The Expert Advisor (EA) is designed for capital distribution. We have made every effort to ensure that the minimum deposit is $100 USD.
This advisor is intended for trading with the broker Deriv. The EA has been optimized over the past year, startin
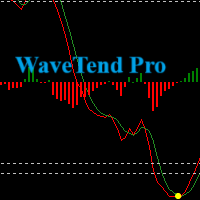
Introducing our Wave Trend Oscillator Indicator , exclusively designed for MetaTrader 5 . This advanced tool is a must-have for traders who seek precision and efficiency in their trading journey. Our oscillator is built on the principles of wave trend analysis , capturing the ebb and flow of market trends with unparalleled accuracy. It helps traders identify potential buying and selling points based on market wave patterns, enabling you to stay ahead of the market. One of the key features of ou
Description of work
The 'MA7 Agave' indicator is based on the standard Average Directional Movement Index (ADX) indicator. Shows the intersection of the +DI and -DI lines. Detailed information about the 'MA7 Agave' indicator.
Indicator settings
General settings: ADX period - Average Directional Movement Index indicator period.
'MA7 Flax' settings: ATR period – Average True Range indicator period, (0 – not used); ATR multiplier – Average True Range indicator value multiplier, coeff; Remove

Compared to simple or exponential moving averages, slow adaptive trend lines might offer a more nuanced view of the trend by adjusting their sensitivity based on market conditions. However, their slow nature might also mean they are late in signaling reversals when market conditions change rapidly - and that is the difference between them and our SlowAMA .
SlowAMA was designed to be a better long-term trend indicator than EMA and other Moving Averages. It uses our JurMA calculations, reducing

Master Breakout is a very accurate expert advisor for gold and all pair currencies. This EA is designed with a moving average indicator to see trends, RSI to see momentum, and range/time breakout candles for entry points.
Signal Features : Range breakout Time range breakout Fractal breakout PSAR breakout
Additional Signal : Moving average RSI
Recommendations:
Currency pair: XAUUSD/GOLD and ALL PAIR CURRENCIES Timeframe: M5 Minimum deposit currencies : $250 ($500 recommended) Minimum de

This indicator helps you identify support and resistance levels. Also it adds break points when level is broken. Price sometimes goes back to break point. It has 4 technical parameters and 4 buffers for expert advisors. Buffer indexes: 0 - Resistance, 1 - Support, 2 - Resistance break point, 3 - Support break point". Number of Levels: Determines how many levels are on graph ( if 3 - 3 levels of support and 3 levels of resistance) Tolerance in percentage %: This parameter is used to filter out

Contact me through PM for a 10% special discount on every purchase of all my EAs.
If you need MT4 version or can't afford renting/purchasing contact me for alternative solution. Buyer of Nexus Portfolio will receive free EAs that I make in the future by including them into Nexus Portfolio. Only a limited number of copies will be for sales. Price will also be increased gradually according to long term performance to protect its scalability. Live Signal Starting Price: $3500. Current Price: $45

The Morning Star candlestick pattern is formed by three candles. Here’s how to identify the Morning Star candlestick pattern: The first candle must be bearish The third candle must be bullish The second candle must be small compared to the others, like a Doji or a Spinning Top The color of the second candle doesn’t matter Ideally, the body of the second candle shouldn’t overlap with the bodies of the other two candles This 3-candle bullish candlestick pattern is a reversal pattern, meaning

The Three White Soldiers candlestick pattern is formed by three candles. Here’s how to identify the Three White Soldiers candlestick pattern: Three consecutive bullish candles The bodies should be big The wicks should be small or non-existent This 3-candle bullish candlestick pattern is a reversal pattern, meaning that it’s used to find bottoms. For this reason, we want to see this pattern after a move to the downside, showing that bulls are starting to take control. When a Three White Sold

The Three Inside Up candlestick pattern is formed by three candles. Here’s how to identify the Three Inside Up candlestick pattern: The first candle must be bearish The second candle must be bullish The close of the second candle should ideally be above the 50% level of the body of the first one The third candle should close above the first one This 3-candle bullish candlestick pattern is a reversal pattern, meaning that it’s used to find bottoms. For this reason, we want to see this patter

The Bullish Harami candlestick pattern is formed by two candles. Here’s how to identify the Bullish Harami candlestick pattern: The first candle must be bearish and have a big body The second candle must be small and bullish The second candle is inside the body of the first candle This 2-candle bullish candlestick pattern is a reversal pattern, meaning that it’s used to find bottoms. For this reason, we want to see this pattern after a move to the downside, showing that bulls are starting t

The Tweezer Bottom candlestick pattern is formed by two candles. Here’s how to identify the Tweezer Bottom candlestick pattern: The first candle is bearish The second candle is bullish The lows from both candles should be pretty much at the same level This 2-candle bullish candlestick pattern is a reversal pattern, meaning that it’s used to find bottoms. For this reason, we want to see this pattern after a move to the downside, showing that bulls are starting to take control. When a Tweezer Bot

The Three Outside Up candlestick pattern is formed by three candles. Here’s how to identify the Three Outside Up candlestick pattern: The first candle is bearish and small The second candle is bullish and engulfs the first one completely The third candle is bullish and closes above the other ones This 3-candle bullish candlestick pattern is a reversal pattern, meaning that it’s used to find bottoms. For this reason, we want to see this pattern after a move to the downside, showing that bulls ar
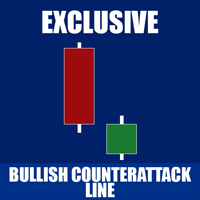
The Bullish Counterattack Line candlestick pattern is formed by two candles. Here’s how to identify the Bullish Counterattack candlestick pattern: The first candle is bearish and big The second candle is bullish and small There’s a gap between the close of the first candle and the open of the second candle They both close at the same level This 2-candle bullish candlestick pattern is a reversal pattern, meaning that it’s used to find bottoms. For this reason, we want to see this pattern after a

Calculate the Variance of prices on the chosen time frame and compare with the price range reached. Or in other words how mutch is price moving in the recent candles? Two impots: Candle = 4 (Default) number of previous candle to calculate Backward = 500 (Default) How many candle to go backward
Variance is calculated as follow: Variance(X) = Average(X 2 ) – [Average(X)] 2
Subsequently Variance is rapported to the price range fo the chosen period (i.e. 4 candles) Indicator = Variance(X) / (
FREE
Introducing our ICT Trading Bot for MT5 A sophisticated solution designed to automate your trading.
During the ASIA session, the bot identifies a customizable price range, allowing for strategic adjustments. Post-ASIA, it patiently awaits a liquidity grab above or below the established range. A key feature is the detection of a significant fair value gap candle in the opposite direction of the grab, its size measured against the ATR value. Subsequently, a limit order is strategically placed a

Introducing The Day Trader System: Your Shortcut to Day Trading Success! Are you a day trader seeking simplicity without compromising profitability? Look no further! We present The Day Trader System – your go-to solution for identifying lucrative opportunities in the fast-paced world of Forex. Simple Yet Powerful: The Day Trader System is a straightforward yet highly effective indicator designed exclusively for day traders. Say goodbye to complexity and hello to a system that simplifies
FREE
****** PRESENTIAMO CBAlgoGrid EA MT5 ******* live account CBAlgoGrid + CBAlgoNews operational from 01/23/2024
Il CBAlgoGrid EA rappresenta un sofisticato sistema automatico progettato per operare nel mercato Forex,
capitalizzando i movimenti giornalieri ed in particolare nelle fasi di consolidamento.
Le operazioni vengono attivate in risposta a modelli specifici identificati tramite l'analisi di indicatori tecnici come ADX, media mobile e RSI.
Grazie alla gestione avanzata delle transaz

Exclusive FOREX account HEDGE FuzzyLogicTrendEA is based on fuzzy logic strategy based on analysis 5 indicators and filters.
When the EA analysis all this indicators, it decides, based on its fuzzy strategy, which trade will be better: sell or buy.
As additional functions, it´s possible defines spread maximum, stop loss and others.
Recomm. Symbol: EURUSD, AUDUSD, GBPUSD, NZDUSD, USDCAD, AUDCAD, EURCAD e USDJPY
Recomm. timeframe: H1.
Backtest were done on EURUSD, H1, 01/07/2023 - 26/0

Market Cycle and Trading Sessions Indicator
Introducing our Market Cycle and Trading Sessions Indicator, a tool designed to provide you with a comprehensive view of the financial market like never before. Observe the market's pulse with our exclusive indicator. Gain a deep understanding of market phases, from accumulation to distribution, to make informed, strategic decisions with a high probability.
What makes our indicator?
1. Date Range for Calculations: Customize the start and end da

ACCOUNT FLIPPER EA A trading bot for GBPUSD Lot size is calculated by multiplying the lot factor by each 1000 USD on account. Advisable to use account sizes of USD 1000 and above. Account types: Hedge accounts, Standard accounts are preferred i.e. no commissions, Use well regulated brokers eg ICMarkets. all this provides room for the strategy to work smoothly for stabilized results and removing the possibility of the model crashing. ADJUST The Time settings to your own time zone because the
FREE

This indicator is designed to help traders to help them Synchronize objects across all charts that have the same pair/currency.
Applicable objects: -Rectangle
-Trendlines
-Trendlines by Angle
-Horizontal Lines
-Vertical Lines
-Arrow Lines
-Channels
Known Issues : - Visualization is not copied to the other charts. - If indicator is only placed in one chart, other charts with the same pair/currency will have difficulty deleting the objects if there is not Sync Objects In Charts indicato
FREE

Baby WPR opera automáticamente en base al algoritmo oscilador WPR. Es capaz de llegar a generar resultados alcistas en las pruebas realizadas con el par de FX GBPUSD en el marco temporal H1 Se puede testear en otros instrumentos ajustando sus diversas opciones. Diseñado para operar con un capital mínimo de 100 USD y un apalancamiento de 1:30 Ideal para los iniciados. Con Baby WPR no esperes grandes beneficios con la configuración conservadora por defecto, por el contrario habrán DD significativo
FREE
Are you tired of the hassle and delays in closing your trades. Introducing our revolutionary One Click Close Tool, designed for both MT4 and MT5 platforms, empowering traders with seamless control over their trade closure experience. Instant Execution : Experience lightning-fast trade closures with just a single click. No more navigating through multiple windows or confirmation dialogs take full control of your trading decisions instantly. Our tool boasts a user-friendly interface, ensuring tha
FREE

DeepX Black Edition Expert Advisor is a cutting-edge trading tool meticulously designed for traders seeking a robust and low-risk strategy. Leveraging the power of candlestick patterns, this specialist excels in trend detection, ensuring timely market entry and exit points. With a predefined profit limit and loss limit, the expert advisor prioritizes risk management, providing users with a secure trading environment. Optimized for the H4 time frame, this expert aligns with traders who prefer a b

The underlying strategy of this indicator is based on identifying momentum in the market and attempting to capture the direction of the trend through transitions between bullish and bearish moments. Utilizing bands around the RWMA allows for identifying potential overbought and oversold situations in the market.
1. Calculation of the Range Momentum Index (RMI): The RMI is based on a combination of the Relative Strength Index (RSI) and the Money Flow Index (MFI), both of which are momentum ind

O Chart Control é um indicador que permite de forma rapida e pratica alterar o timeframe e ativo do grafico, possibilitando que voce possa fazer todas as suas analises em apenas um grafico sem precisar abrir vários, além disso voce pode escolher o entre os temas claro e escuro para o qual melhor se adapta a sua preferencia.
MT4: https://www.mql5.com/pt/market/product/112155
FREE

Introducing Trader's NotifierYo,ur Ultimate Trading Companion
Are you tired of missing crucial market moments because you looked away for just a moment? The frustration of waiting for that perfect confluence, only to realize you've missed it, can be overwhelming. But fear not, because Trader's Notifier is here to revolutionize the way you trade!
Seize Every Opportunity
Trader's Notifier is your vigilant ally, keeping a watchful eye on your charts so you don't have to. No more staring at t
FREE

The Bearish Engulfing candlestick, a potent signal in technical analysis, marks a potential shift in market sentiment. This compelling pattern unfolds when a smaller bullish candle is completely overshadowed by a larger bearish candle. The Bearish Engulfing signifies a transition from bullish to bearish momentum, capturing the attention of traders anticipating a downtrend. Savvy investors leverage this pattern to identify potential selling opportunities, signaling a shift towards bearish market

Elevate your trading experience with Dynamic Trader EA MT5 , a cutting-edge trading robot designed to optimize your investment strategy. This advanced algorithm harnesses the power of four key indicators: RSI ( Relative Strength Index ), Stochastic Oscillator , MACD ( Moving Average Convergence Divergence ) and ATR ( Average True Range ) to make informed and precise trading decisions. ATR is used to dynamically set stop-loss and take-profit levels based on market volatility. IMPORTANT!
Read

Introducing AI Precision Trader: Unleash the Power of AI for Optimal Trading Performance!
Embark on a revolutionary trading journey with AI Precision Trader, an Expert Advisor (EA) that stands at the forefront of innovation. Meticulously designed with cutting-edge Artificial Intelligence (AI) technologies, this EA redefines precision and profitability in algorithmic trading.
Optimized Risk Management:
Experience a new level of confidence with AI Precision Trader's advanced risk manage

The Hanging Man candlestick, a significant player in technical analysis, provides a crucial signal for potential trend reversals in financial markets. Characterized by its small real body, long lower shadow, and minimal upper shadow, the Hanging Man hints at a shift from bullish to bearish momentum. Savvy traders use this pattern to identify potential selling opportunities, suggesting a possible weakening of an uptrend. Dive into the intricacies of the Hanging Man candlestick to refine your mark
Learn how to purchase a trading robot from the MetaTrader Market, the store of application for the MetaTrader platform.
The MQL5.community Payment System supports transactions via PayPal, bank cards and popular payment systems. We strongly recommend that you test the trading robot before buying, for a better customer experience.
You are missing trading opportunities:
- Free trading apps
- Over 8,000 signals for copying
- Economic news for exploring financial markets
Registration
Log in
If you do not have an account, please register
Allow the use of cookies to log in to the MQL5.com website.
Please enable the necessary setting in your browser, otherwise you will not be able to log in.