Watch the Market tutorial videos on YouTube
How to buy а trading robot or an indicator
Run your EA on
virtual hosting
virtual hosting
Test аn indicator/trading robot before buying
Want to earn in the Market?
How to present a product for a sell-through
Technical Indicators for MetaTrader 4 - 22
Strong and weak Pairs is a trend following indicator to help you choosing the pairs to trade based on the currency score. Strong and weak Pairs is comparing currencies position to the moving average for all major pairs then display the position score from Zero (0) to Seven (7) with two lines on the chart. 7 is the strongest currency and zero is the weakest currency. Additionally there is a dashboard displaying all the currencies score to choose the pair you will trade. Strong and Weak Indicator
FREE
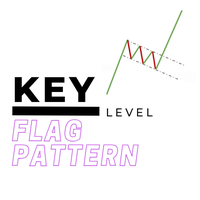
The Key level flag pattern is one of it's kind when it comes to flag patterns on the Metatrader platform. It is perfect for entering pullbacks in a trend, retests on certain structure or price action, or when you are just looking for a confirmation entry on a zone or odrerblock. It's works on all markets, whether it's forex, crypto currency, stocks or futures. In it's algorithm it incorporates an: 1. Impulsive move (leg/pole) = this is the high momentum move which creates the leg/pole of the pat

FuturePriceM15 - один из немногих индикаторов, который делает прогноз цены прямо на ценовом графике. Алгоритм расчета индикатора основан на быстром преобразовании Фурье. Имея колебательное поведение цены, функция Фурье прогнозирует ее поведение в дальнейшем. Индикатор устанавливается обычным образом на график с торговым инструментом указанным в переменной symbol с периодом M15 , данный временной период является самым оптимальным для работы с любыми торговыми символами. После установки, индикато
FREE

MASi Three Screens is based on the trading strategy by Dr. Alexander Elder. This indicator is a collection of algorithms. Algorithms are based on the analysis of charts of several timeframes. You can apply any of the provided algorithms.
List of versions of algorithms:
ThreeScreens v1.0 - A simple implementation, with analysis of the MACD line; ThreeScreens v1.1 - A simple implementation, with analysis of the MACD histogram; ThreeScreens v1.2 - Combines the first two algorithms
FREE

Pullback Viewer is designed to show valid pullback points in a bearish or bullish trend.
What is considered a valid pullback?
A valid pullback needs to have a body close outside the previous candle high (in a bearish trend ) or previous candle low (in a bullish trend ). If the candle wicks out the previous candle, it's not a valid pullback.
Pullback must liquidate the previous candle with a clean candle body close.
When is this indicator useful?
It's useful to under
FREE

This tools is design to easily forecast the projection of the current trend through the inputs of Zigzag and get out of the market when the trend do not the ability to maintain it's volatility to go further... the indicator gets the initial and final price from the value of zigzag automatically by adjusting the intdepth of zigzag. You can also switch from Projection to Extension from the inputs tab of indicator.
FREE

万能线段划分指标简介: 万能线段划分是依照两根相互缠绕的均线,依金死叉为标准,将金死叉两边的高低点进行连接开成线段划分。本指标可以设定不同参数多级别叠加使用。 万能分段的原理: 在任意一组均线组成的均线系统中,均线之间的相互缠绕,形成的金死叉是有位次关系的。这点,作者在这里算是首次对外公开这个秘密。上图的均线系统中,走势处于一个较大级别的振荡行情中,均线之间相互缠绕比较频繁,金死叉的数量较多,所以,情况比较复杂。 我们知道,均线可按其周期大小进行位次排序。上图均线依照周期从小到大排序为:MA10,MA30,MA60,MA144,MA233,依照这组均线的位次关系,将每相邻两根均线金死叉做上标注。如:MA10&MA30金死叉标注为“1”,MA30&MA60金死叉标注为“2”,MA60&MA144金死叉标注为“3”,MA144&MA233金死叉标注为“4”。我们将两相邻均线金死叉完全标注完毕后,发现图上还有部份金死叉并未被标注到,这些未被标注到的金死叉全部是非相邻均线之间发生的金死叉。我们依照以上方法,可以识别出均线组之间金死叉的级别位次关系。市场行情的发展是依照此级别位次关系,从小到大
FREE
Dear everyone, Today, I would like to introduce you to an amazing tool on the MetaTrader 4 platform - "Pivotal Moments." This indicator will be a reliable companion on your trading journey in the financial market. "Pivotal Moments" is not just an ordinary indicator, but an intelligent tool that helps you better understand significant fluctuations on the chart. With a variety of customization options, it provides valuable information and deep insights into the market. The key features of "Pivotal
FREE
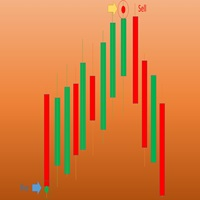
Wave Entry Alerts Oil is a custom indicator developed by Azad Gorgis for MetaTrader 4. This indicator is designed to provide alerts based on ZigZag patterns, specifically tailored for trading on the Oil (XIT/USD) symbol.
Key Features: - Chart Window Indicator: The indicator is designed to be displayed on the main chart window. - Arrow Signals: The indicator generates arrow signals on the chart, indicating potential reversal points based on ZigZag patterns. - Customizable Parameters: Traders c
FREE

This is an indicator detecting trend direction. It uses the popular Bill Williams Alligator. It shows market state on all timeframes on one chart. As is well known, traders gain the main profit on the Forex market trading by trend, and losses usually occur when the market is flat. So, in order to gain profit a trader should learn to detect trend market and direction of a current trend in a rapid manner. This indicator has been developed for this purpose. MTF Alligator helps to: Profitably trade
FREE

A visual multitimeframe indicator designed for both beginners and professionals. Developed using MACD, CCI and Laguerre and the principle of three screen. This original indicator will help you: accurately enter the market; reduce the number of errors when opeinng orders; visually see market movement; predict price movement(in absent of significant news); do not rush to close profitable trades prematurely and increase profit; do not rush to enter the market and wait for "easy prey". The
FREE

English : A GF_support+MA.mq4 indikátor átfogó eszközként szolgál a kereskedési döntések támogatására a MetaTrader 4 platformon. Fő funkciója, a LookBackPeriod beállítás lehetővé teszi a kereskedők számára, hogy beállítsák a támogatási és ellenállási szintek kiszámításához használt időszak hosszát. Ez a paraméter határozza meg az elemzési periódus hosszát a gyertyákban, ami döntő fontosságú a piaci csúcsok és mélypontok azonosításához, ezáltal pontosan megrajzolja a támasz- és ellenállásvonala
FREE
Download the free version here.
A Full Concept of BUY/SELL Scalping Strategy Trend detection is one of the basic challenges of every trader. Finding a way to tell when to enter a trade is very important, timing is a game changer, not too early and not too late. Sometimes, due to not knowing the market conditions, the trader closes his positions with a small profit or allows the losses to grow, these are the mistakes that novice traders make. Indicator Trend Whipper is a complete trading st
FREE
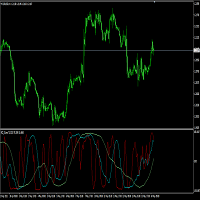
RCI is one of the technical charts and is an abbreviation that stands for "Rank Correlation Index". It is an index to judge overbought or oversold based on how much the latest stock price has risen or fallen. RCI ranks dates and prices over a period of time and indexes the correlation between -100% and + 100%. For example, if the calculation period is 9, it will be + 100% if the price continues to rise for 9, and -100% if the price continues to fall for 9. Generally, it is judged that it is over
FREE

The "Trend Edges" indicator determines whether the trend is rising or falling. It is suitable for any time frame (tested on DAX).
The indicator should be treated like Bollinger Bands, meaning that if it breaks out upwards, you can buy with a stop loss below the lower edge.
Find a trending pair, index or CFD. Additionally :
-Sound alert on trend change.
-Alert Notification
-Alert Notification on your mobile phone Check my other indicator "Trend Edges histogram"
FREE
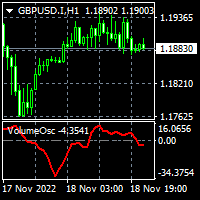
To download MT5 version please click here . The Volume Oscillator measures volume by analyzing the relationship between two Moving Averages. The Volume Oscillator indicator subtracts a fast MA from slow MA. The fast and slow MA periods are configurable via input tab. Volume indicators are an ingredient of trading systems to avoid entry in thin liquidity markets. Having set a threshold on Volume Oscillator you can avoid entering chop. Buffers are available to access via EA.
FREE
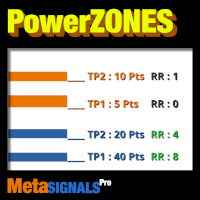
Strategic Zone touched x3, x4, x5 times >> TP1/TP2/TP3 in points or value >> Check visually the safety of your Risk/Reward ratio Non-Repainting/Non-Redrawing and Non-Lagging Indicator - Ideal from both manual and robot trading - Fits all assets and all time frames Limited time offer then back to >> $99 After purchase, please contact me on this channel for recommended and personalised settings
Key Features
1. Dynamic PowerZONES: Instantly visualize really strong support and resis

This indicator scans for you up to 30 trading instruments and up to 8 timeframes for occurrences of the high probability reversal patterns: Double Tops/Bottoms with fake breakouts . Please read also the blog post " Professional Trading With Double Tops/Bottoms And Divergences! " which explains the concepts behind the ULTIMATE Double Top/Bottom indicator and how you can use a professional top-down approach. This FREE Version of the Scanner scans only EURUSD and GBPUSD. The full version of the sca
FREE

"Auto FIBO" indicator - is great auxiliary tool in trading! Indicator automatically calculate and place on chart Fibo levels and local trend lines (red color) Fibonacci levels indicate key areas where price can reverse Most important levels are 23.6%, 38.2%, 50% and 61.8%
You can use it for reversal scalping or for zone grid trading There are plenty of opportunities to improve your current system using Auto FIBO indicator as well // More great Expert Advisors and Indicators are availab
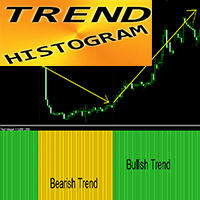
Forex Indicator "TREND Histogram" for MT4 TREND Histogram indicator is much more sensitive and efficient than any standard MA cross Indicator can be in 2 colors: Yellow (gold) for bearish trend and Green for bullish trend (colors can be changed in settings) TREND Histogram has built-in Mobile and PC alerts It is great idea to combine this indicator with any other trading methods: Price Action, VSA, other indicators // More great Expert Advisors and Indicators are available here:
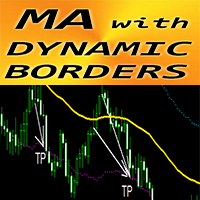
Forex Indicator "MA with Dynamic Borders" for MT4 Indicator has unique feature attached to Moving Average - Dynamic Volatility Borders Dynamic Volatility Borders use Average True Range values for calculation This indicator is great for TakeProfit targeting and SL arrangement on boarder lines Indicator is excellent to combine with Price Action entries as well // More great Expert Advisors and Indicators are available here: https://www.mql5.com/en/users/def1380/seller // Also you a

"Adjustable Fractals" - is an advanced version of fractal indicator, very useful trading tool! As we know Standard fractals mt4 indicator does not have settings at all - this is very inconvenient for traders Adjustable Fractals has resolved that issue - it has all necessary settings: Adjustable period of indicator (recommended values - above 7) Adjustable distance from Highs/Lows of price Adjustable design af fractal arrows // More great Expert Advisors and Indicators are available he

Forex Indicator PINBAR Pattern for MT4 Indicator " PINBAR Pattern " is very powerful indicator for Price Action trading: No repaint, No delays; Indicator detects PinBars on chart: Bullish PinBar - Blue arrow signal on chart (see pictures) Bearish PinBar - Red arrow signal on chart (see pictures) P C, Mobile & Email alerts are included Indicator "PINBAR Pattern" is excellent to combine with Support/Resistance Levels: https://www.mql5.com/en/market/product/100903 // More gre
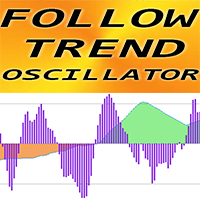
"Follow Trend Oscillator" - is advanced custom indicator, efficient trading tool! User friendly indicator provides opportunities for scalping into the direction of major trend Smooth and adjustable oscillator with signal histo part Green color of oscillator for upward trends, Brown color - for downward trends Oversold values: below -30 ; O verbought values: over 30 There are plenty of opportunities to upgrade even standard strategies with this indicator // More great Expert Advisors and In

Economic Calendar Viewer
This economic events reader is adapted to load data from a csv file. You can prepare the csv file yourself according to this template, you can do it in notepad or csved. The file should normally be named Calendar-MM-DD-YYYY.csv. And contain lines with data column headers according to this example. In the Impact column, i.e. impact on the market depending on the importance of the event, the names accepted from the least important are: None, Low, Medium, High. In column
FREE
The indicator shows the regression channel, in the calculation of which the gold Fibonacci section is used Levels are not built as graphical objects, but use indicator buffers - this allows using this indicator in Expert Advisors Near the channel borders price corrections and reversals are most probable Allows trend and counter trend trading within the channel The slope of the channel shows the direction of the market, and its width - the current volatility. Works on all timeframes, all currency
FREE
The FCPI indicator or Forex Currency Power Index indicator for MT4 is a multi currency pairs indicator that displays 28 pairs on 1 chart, which consists of 8 Major Pairs and 20 Cross pairs. 8 Major Pairs and 20 Cross pairs: EURUSD,GBPUSD,AUDUSD,NZDUSD,USDCAD,USDCHF,USDJPY,EURGBP,EURAUD,EURNZD,EURCAD,EURCHF,EURJPY,GBPAUD, GBPNZD,GBPCAD,GBPCHF,GBPJPY,AUDNZD,AUDCAD,AUDCHF,AUDJPY,NZDCAD,NZDCHF,NZDJPY,CADCHF,CADJPY,CHFJPY. Automatically detects symbols that have a symbol prefix and/or a symbol suffi
G-Ca$H IC Breaker (Source and Breaker Order Block Indicator) If you need support you can message via profile please check out the video and description where I try to answer the most common issues and how to use indicator there is also another short video i have made here https://youtu.be/yB9VutPfr-A We want to help you get the most out of the indicator and we like helping our customers . Please also see our other product https://www.mql5.com/en/market/product/58535?source=Unknown%3Ahttps

Elliott Wave Indicator
Perfect for trading Stocks, Futures, Forex & Crypto The Elliott Wave Indicator Suite is designed around a simple but effective Swing Trading strategy. The Indicator Suite is great for Stocks, Futures and Forex trading on multiple time-frames.
By subscribing to this indicator, you will get: Automatic Elliott Wave Count Elliott Wave Isolation High Probability Pull Back Zones Special 5-35 Oscillator 6/4 Moving Average High and Low's for trade entry and management Autom
The SD Indicator is a powerful tool in the world of Forex trading, that combines two classical strategies: Support/Resistance levels and Supply/Demand zones. The indicator helps traders to identify potential trading opportunities in the market with high accuracy.
Support and resistance levels are key price levels where buying and selling pressure converge, leading to potential price reversals. The SD Indicator identifies these levels in real-time and provides traders with a clear picture of wh

[Deviation of each indicator MT4] is a collection of 18 indicators, and one of them can be arbitrarily selected to participate in the calculation. It can calculate the deviation form of each indicator and can prompt an alarm.
Parameter setting description:
[indicators] is to choose one of the 18 indicators to participate in the calculation (this parameter is very important) .
[period] is a common cycle for each indicator.
[Method] is the MA mode of some indicators.
[Apply_to] is the
FREE

This indicator mostly inspired from BW-ZoneTrade custom indicator from MT5. How To Use:
BUY when both dots colored Green. SELL when both dots colored Red. In addition to original one, MACD-OsMA-generated signal also can be drawn. Input Description:
MA_period_short: Faster EMA period for MACD. Applied when drawMACD is true. MA_period_long: Slower EMA period for MACD. Applied when drawMACD is true. MACDperiod: MA period for MACD. Applied when drawMACD is true. drawMACD: When true, draw an addi
FREE

The indicator displays important technical levels on the chart. These levels act as support or resistance for the price movement.
The most important levels are multiples of 100 and 50 pips. You can also display levels in multiples of 25 pips .
When the price reaches the level, an alert or push notification is displayed. MT5 version https://www.mql5.com/en/market/product/69740 Settings Show Levels 100 pips - show levels that are multiples of 100 pips Show Levels 50 pips - show levels that a
FREE

Daily pivot are relatively important in trading. This indicator have options to select 5 commonly use pivot point calculations. User input Choose Pivot Point Calculation ( Method Classic, Method Camarilla, Method TomDeMark, Method Fibonacci or Method Woodies. ) Choose Applied Timeframe for the calculation (M5, M15, H1, H4, D1, W1 etc) Can be attached to any timeframe Choose color of Pivot point For MT5 version, please refer here: https://www.mql5.com/en/market/product/38816
FREE
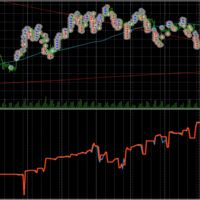
Graph shows your balance and equity in real time similar to the tester graph which is nice to see your real progress vs tester graph. This code was copied from mql5.com, it was free and it works im just putting it here to make it easier for us :-) https://www.mql5.com/en/code/13242
https://www.mql5.com/en/code/8454 .. original code
//+------------------------------------------------------------------+
//| Equity Monitor |
//| Monitori
FREE

EMA Above Below Bid price Технический индикатор в помощь трейдеру. Данный индикатор, показывает расположение пяти ЕМА,
пяти средних скользящих, относительно цены формирующей японские свечи или бары (цена Bid ).
О понятии ЕМА.
Скользящая средняя (moving average, MA) — это дополнительная линия на графике цены актива.
Внешне она повторяет график цены, но с небольшим запозданием и более гладко, без колебаний. Основные характеристики:
1. Показывает тренды. Если скользящая устрем
FREE
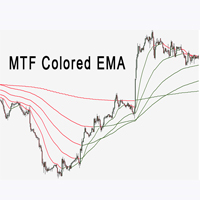
The Multi Time Frame EMA indicator is of great help in determining trend direction. It can be an excellent addition to your existing strategy or a new foundation. We humans can make better decisions when we see better visually. So we designed it to show different colors for uptrends and downtrends. Anyone can customize this in the way that works best for them. We can set the Ema indicator for all timeframes on a chart.
FREE

Defining Range ( DR ) and Implied Defining Range ( IDR ) indicator Pro with added features from free version
Show DR and IDR ranges Sessions on the chart for RDR Regular defining range (New York Session)
ADR After defining range (Asian session) ODR Outside defining range (London Session)
Buttons on chart to enable / disable :
Show Imbalance ( IMB ) Show Volume Imbalance ( VIB ) Show Gap's between open and close
Show Standard Deviation ( SD )
Show last 3 Sessions

The indicator displays two Moving Average lines on the chart with parameters specified in the settings. It issues a signal in the form of arrows and a sound at the intersection of these Moving Average. In the indicator settings, you can set the period of fast Moving Average ( Fast MA Period ) and slow Moving Average ( Slow MA Period ). And also Shift, Applied Price, Method and Timeframe for two Moving Averages separately. Important:
The main difference from oth
FREE
The Scalper Signal Tarek indicator for mt4 (Metatrader 4) delivers scalping signals for any currency pair on any time frame, even on the daily chart. The indicator is very reliable, lightweight, and will not slow down your trading platform. The signals appear on the main MT4 chart window in the form of green and red colored signal arrows. Buy & sell signal: Open a buy position when the green arrow gets printed on the chart. Open a sell position when the red arrow gets printed on the chart. Aim f
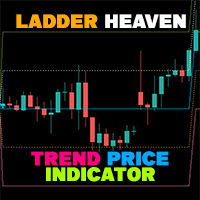
If you have difficulty determining the trend as well as entry points, stop loss points, and take profit points, "Ladder Heaven" will help you with that. The "Ladder Heaven" algorithm is operated on price depending on the parameters you input and will provide you with signals, trends, entry points, stop loss points, take profit points, support and resistance in the trend That direction.
Helps you easily identify trends, stop losses and take profits in your strategy!
MT5 Version: Click he
FREE
Keltner MTF (Not repaint!!!) is a channel indicator that can display price channels from different timeframes on a single chart of quotes. For example, on the H1 chart, you can see at the same time the Keltner price channel from the M15 and H4 timeframe. This tactic makes it possible to more clearly understand the tendency of price movements, to determine trading goals and points for making deals. How the Keltner MTF Indicator Works The Keltner MTF indicator can be used both - for trading in

" A trading range occurs when a financial instrument trades between constant high and low prices over a period of time. The upper part of the trading range of a financial instrument often provides price resistance, while the lower part of the trading range usually offers price support. Traders can enter in the direction of a breakout or breakdown from a trading range... "
This is the "Classical Theory" understanding of ranges. We have a different understanding of the nature of ranges and th

Professional Histogram ( PH ) is a highly efficient and reliable tool for trading Forex, CFDs and binary options. PH is easy to use and configure both for beginners and experienced traders. Unlike most indicators, Professional Histogram finds longer trends and gives fewer false signals. When a buy or a sell signal appears, an alert is triggered allowing you to open a position in a timely manner and avoid sitting at your PC all the time. Professional Histogram for the MetaTrader 5 terminal :

Introduction to Fractal Moving Average Fractal Moving Average indicator was designed as part of Fractal Pattern Scanner. Inside Fractal Pattern Scanner, Fractal Moving Average Indicator was implemented as multiple of chart objects. With over thousands of chart object, we find that it was not the best and efficient ways to operate the indicator. It was computationally too heavy for the indicator. Hence, we decide to implement the indicator version of Fractal Moving Average indicator to benefit
FREE

A powerful trend analysis tool for traders of all levels Super Trend Analyzer is a technical analysis tool that uses the Relative Strength Index (RSI) and Moving Average (MA) indicators to identify trends in the market. It is a versatile tool that can be used by traders of all levels of experience.
How does it work An uptrend begins when the main trend line and the auxiliary trend line cross from below and the lower minor oscillator is on the rise. A downtrend begins when the main trend line a
FREE

TILLSON MOVING AVERAGE Also known as TMA or T3 indicator. It is a moving average that uses EMA and DEMA in its formula and is calculated with the 3rd degree Binomial expansion. Pros; 1- erroneous signals encountered in other moving averages ( continuous zig zag ) has been reduced as much as possible. 2- prevented the delays seen in classical moving averages . 3- Very successful in trends Cons 1- It is not effective in horizontal markets. Setting parameters; period ; Altho
FREE
Simulator for Risk / Reward ratio calculator We-RiskReward is a MT4 indicator made by the We-Trading team to simulate an order with Risk / Reward calculator.
Horizontal Lines This indicator show you 3 horizontal lines that are: Open line Take Profit line Stop Loss line You can move the lines and you will see R/R and Lots calculation in real time. You can use it to simulate Long and Short positions.
Indicator parameters As input parameters you need to check only the Risk for trade. For e.g. y
FREE

This indicator plots another symbol on the current chart. A different timeframe can be used for the symbol, with an option to display in multiple timeframe mode (1 overlay candle per several chart candles). Basic indicators are provided. To adjust scaling of prices from different symbols, the overlay prices are scaled to the visible chart price space.
Features symbol and timeframe input MTF display option to vertically invert chart, eg overlay USDJPY, invert to show JPYUSD
data window values
FREE
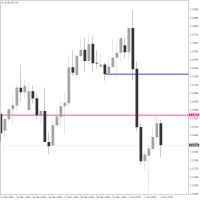
Crosshair Levels : Free version of Object Synchronizer. ** No synchronization of objects among grouped charts and no group chart features supported in this version. Are you bored to save and load template many times for the same symbol for many chart time frames? Here is the alternative. With this indicator, you enjoy creating 3 objects. All objects that you created/modified always are moved easily with clicking the object, moving cursor to the point you wanted and clicking again). Supported
FREE
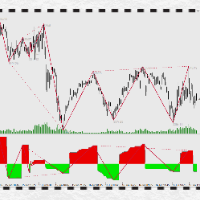
万能背驰指标简介(DivergenceLines) 注意注意,这个指标不能单独运作,对以下两个指标有依赖,请确保先获得以下两个指标后才购买本指标! 1) 动力之梯(PowerTrapezoid) (力度评估副图指标,本指标) 2) 万能分段(LinesSegment) (线段划分主图指标) 。 3)万能背驰(DivergenceLines,本指标) (比较力度背离主图指标)。 指标原理: 通过获取动力之梯指标的筹码堆积值,依照万能分段指标为依据,对同向线段向前回朔,进行一一对比,当后面线段力度比前面力度小时,定义为背驰(背离),背驰的两个高点(或两个低点)之间可以连接一条背驰线,当某个高点(或低点)连接的背驰线越多,这个点就构成了多个单级别背驰区间套。
FREE

Fractal is one of the main indicators in a number of strategies. Volume Fractals has expanded the functionality of the standard indicator version. The product features fractals sorting and displaying fractals representing both price and volume extreme points.
Application Stop losses Reversal signals Placing pending orders for a fractal breakout
Options Bars of history - number of chart bars the indicator is displayed for Left side minimum bars - minimum number of bars to the left of the frac
FREE

This indicator is stand alone version from MP Pivot Levels (All in one) containing Demark's Pivots.
Calculations: PP = X / 4 R1 = X / 2 - LOWprev S1 = X / 2 - HIGHprev Uses: When the pair currency price may change the direction of movement. Possible constraints of support and resistance that creates plateaus for the currency pair prices. Tendency identification by comparing the present prices according to current day's pivot point and also the prior day's pivot points. ___________
FREE

This indicator is an addition to "Trend Edges."
The "Trend Edges histogram" indicator determines whether the trend is rising or falling. It is suitable for any time frame (tested on DAX).
Find a trending pair, index or CFD. Additionally :
-Sound alert on trend change.
-Alert Notification
-Alert Notification on your mobile phone Check my other indicators.
FREE

Suitable for multi time frame market direction prediction. Green and red color indicate the buy and sell call respectively. Green indicator is denote buy call and Red indicator denote the sell call. push notification is available to send instant message to you when green or red indicator will be appear. you have to activate the option at the time of mapping this indicator to you chart
FREE

Moving Average Dashboard Bars ago is a unique multi currency, multi time frame dashboard. The dashboard is very simple. You select two moving averages, the instruments and timeframes The Moving Average Dashboard Bars ago then shows how how many bars ago the moving averages made a bullish or bearish crossover. It also shows you in real time when there is a bullish or a bearish crossover. The indicator plots in a subwindow. The Moving Average Dashboard Bars ago can be beneficial if you are trading
FREE

Quarterly Cycles
Quarterly Cycles is based on the Quarterly Theory developed by Daye ( traderdaye on X ) T his is an aid to the user to find Cycles and it is NOT automatic detected, user can select AMDX or XAMD in each Cycle and it will be visually draw on the chart. Quarterly Cycles: Yearly, Monthly, Weekly, Daily, 6 Hour (90 minutes)
Yearly Cycle: The year is divided in four sections of three months each Q1 - January, February, March Q2 - April, May, June Q3 - July, August, September Q4

The indicator displays crossing zero level by Moving Average of Oscillator (OsMA) in the form of arrows. The indicator notifies about a signal by means of a pop-up Alert window, or sending notification to e-mail.
Parameters Fast EMA Period - fast EMA. This is an exponential moving average from a price with a short period. Slow EMA Period - slow EMA. This is also an exponential moving average of a market price but with a longer period. Signal SMA Period - MACD SMA. This is a signal line which i
FREE

FZR indicator determines fractal zigzag reversal pattern of all the time frames of the chosen symbol and shows the information in the Info label. Indicator draws the detected pattern in the chosen time frame and also you can select in the menu to draw the trend line according to FZR peaks. What it is FZR? See the first picture in the screenshots. As you can see for every peak of FZR the AO indicator must cross zero line. FZR indicator determines the trend direction.
How to use FZR for trading?
FREE

If you like this project, leave a 5 star review. Follow on instagram: borelatech As institutionals trade large volumes, it is not uncommon for them to try to
defend their position at specific percentage levels. These levels will serve as a natural support and resistance which you can use
either to enter a trade or be aware of possible dangers against your position. This oscillator will show you the percentage variation for the: Day. Week. Month. Quarter. Year. In a subwindow where you trace yo
FREE

An indicator that displays the Pin Bar candlestick pattern. With the help of coefficient settings, the ratio of shadow, body and size is easily adjusted. It is possible to filter by trend (2 moving averages) and by reversal (RSI and Bollinger Bands). This is the most popular price action pattern. A multi-currency dashboard is available. With it, you can easily switch between charts.
Trading Patterns: Retest by trend. False breakout. Other.
EURUSD, GBPUSD, XAUUSD, ... M15, M30, H1.
Input p
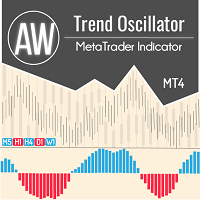
Trend oscillator with advanced filtering system. It determines the trend, its weakening and strengthening. Has a built-in multi-timeframe panel. AW Trend Oscillator works on any timeframes and on any symbols (currencies, indices, oil, metals, stocks). MT5 version -> HERE / Problem solving -> HERE Features and Benefits:
Advanced Trend Filtering Changing the sensitivity of the indicator in one click Easy setup Multi-timeframe panel Ability to move and minimize the panel Works on any symbol
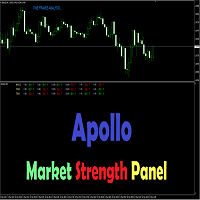
Apollo Market Strength Panel is a multi-timeframe indicator which can be helpful to forex and binary options traders. The panel represents market conditions on several time frames from M1 up to H4. The indicator provides info on three important market aspects. They are Trend, Force and Impulse. If all these 3 components align, the indicator will provide you with a BUY or a SELL signal depending on the market direction. The indicator plots signals right on your chart. You can choose what time fr

The indicator rely on The Toby strategy >> The mother candle which is bigger in range than the previous six candles.
A vertical line shows the last Toby Candle with the targets shown up and down. The strategy is about the closing price out of the range of the toby candle to reach the 3 targets..The most probable to be hit is target1 so ensure reserving your profits and managing your stop lose.
FREE

Ska ZigZag Line indicator determines the overbought and oversold regions within a trend. The indicator determines the overbought region by the candlestick high and the oversold region by the candlestick low in a form of a line. To utilize the full strategy i recommend using "Ska ZigZag Line" together with "Ska ZigZag BuySell". NOTE: This indicator is a line based indicator. HOW TO USE: Sell Signal; Place a sell trade when the Ska ZigZag BuySell indicator arrow appear on top of the Ska ZigZag Lin
FREE

Key Price Levels Indicator Indicator that shows the highs and lows for the significant price levels for past periods that could be potentially considered as reaction levels. The indicator displays the following price levels: Yesterday high and low The day before yesterday high and low Two days back high and low Last week high and low Last month high and low Last three month high and low (Quarter) Last year high and low
FREE

Function Indicate Buy Sell Signals Indicate Strength of Buy Sell Signals This system is for both type of traders (Short & Long Term) Instead of Other Calculations, Parabolic Sar & Awesome are also used In Any time frame this can be use. What is in for Trader? Trading Switch: Short Term & Long Term Finally, we all knows that Forex Trading needs completely concentrate & proper cash management, So I never promising that my program will never give you loss but I tried well to provide good and respo
FREE

Multi-currency and multi-timeframe indicator MACD. The dashboard can display both the Traditional (true) MACD and the MACD which is built into MetaTrader. On the panel you can see the current state of the indicator — the direction of movement of the MACD lines, their intersection and a pop-up window with the indicator chart. In the parameters you can specify any desired pairs-symbols and timeframes. The scanner can also send notifications about lines crossing each other and about lines crossing
The dollar index is a reliable guide for all currency pairs with the participation of the dollar USD. The indicator helps to filter out false reversals and trade strictly according to the trend. Determines the current direction of the dollar index and the trend change point. It warns with an arrow on the chart and an alert about a trend change. Ready to work with default settings. It is possible to adjust the sensitivity of the trend line. Important
It is strongly discouraged to open a trading

PLEASE HELP REVIEW/ SUPPORT/ SHARE THIS OTHER INDICATOR HERE https://www.mql5.com/en/market/product/51637 AS YOU DOWNLOAD THIS ONE FOR FREE. THANKS.
A. This pivot indicator shows the days Pivot Price. Yellow line is pivot point. Blue line is resistance and red line is support. B. It also shows Resistance R0.5, R1, R1.5, R2, R2.5, and R3 C.It also shows support S0.5, S1, S1.5, S2, S2.5, and S3 INPUT: Under input you will see 3 Variables 1.ExtFomula. Here you can set your preferred exit at a
FREE
Do you know why the MetaTrader Market is the best place to sell trading strategies and technical indicators? No need for advertising or software protection, no payment troubles. Everything is provided in the MetaTrader Market.
You are missing trading opportunities:
- Free trading apps
- Over 8,000 signals for copying
- Economic news for exploring financial markets
Registration
Log in
If you do not have an account, please register
Allow the use of cookies to log in to the MQL5.com website.
Please enable the necessary setting in your browser, otherwise you will not be able to log in.