Help on Indicator


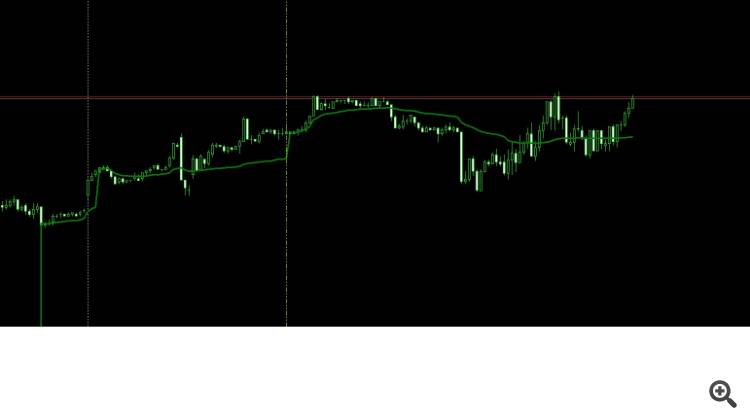
imageHello! trying to make a VWAP indicator that will update the data based on a anchor point that is movable. Like a vertical Line will appear on the chart and from that line towards candle 0, prices are updated and calculated corectly. The problem that I have is with printing that VWAP line on the chart. From the vertical line to right, everything is fine, the line is updated and printed correctly. But from that vertical line to the left, there I have a issue. It should not be printed anything on the left side of that vertical line. Please see the attached picture.

//+------------------------------------------------------------------+
//|                                                       VWAP_C.mq5 |
//|                                                     Daniel Cioca |
//|                                             https://www.mql5.com |
//+------------------------------------------------------------------+
#property copyright "Daniel Cioca"
#property link      "https://www.mql5.com"
#property version   "1.00"
#property indicator_chart_window

#include <ClasePersonale/TradeClassV02.mqh>
CNewBar Newbar;

#property  indicator_buffers 1
#property  indicator_plots 1

#property indicator_color1 clrGreen
#property  indicator_type1 DRAW_LINE
#property  indicator_width1 3

double vwap[];


input bool UseRealVolume=false;

long anchor;
//+------------------------------------------------------------------+
//| Custom indicator initialization function                         |
//+------------------------------------------------------------------+
int OnInit()
  {
   SetIndexBuffer(0,vwap,INDICATOR_DATA);
   ArraySetAsSeries(vwap,true);

   
   datetime   time2 = iTime(_Symbol,PERIOD_H1,6);  
   LineCreate(nameline,time2);

   anchor = ObjectGetInteger(0,nameline,OBJPROP_TIME);
   int bar = iBarShift(_Symbol,PERIOD_CURRENT,anchor,true);


   EventSetTimer(1);
   return(INIT_SUCCEEDED);
  }

void OnTimer(void)
  {
   function();
  }
//+------------------------------------------------------------------+
//|                                                                  |
//+------------------------------------------------------------------+
void OnDeinit(const int reason)
  {

   if(reason==REASON_REMOVE ||reason==REASON_CLOSE || reason==REASON_PARAMETERS
      ||reason==REASON_CHARTCLOSE || reason == REASON_CHARTCHANGE || reason==0)
     {

      ObjectDelete(0,nameline);


      Comment(" ");
     }
 EventKillTimer();

  }


//+------------------------------------------------------------------+
//| Custom indicator iteration function                              |
//+------------------------------------------------------------------+
int OnCalculate(const int rates_total,
                const int prev_calculated,
                const datetime &time[],
                const double &open[],
                const double &high[],
                const double &low[],
                const double &close[],
                const long &tick_volume[],
                const long &volume[],
                const int &spread[])
  {

   function();


   return(rates_total);
  }

//+------------------------------------------------------------------+
//|                                                                  |
//+------------------------------------------------------------------+
void function()
  {
   int bar = iBarShift(_Symbol,PERIOD_CURRENT,anchor);
 
   for(int i =0;i<bar;i++)
     {
      double sumPV=0;
      double sumVol=0;

      for(int j=i;j<bar;j++)
        {
         double price  = (iClose(_Symbol,PERIOD_CURRENT,j)+iHigh(_Symbol,PERIOD_CURRENT,j)+iLow(_Symbol,PERIOD_CURRENT,j))/3;
         double volume = iTickVolume(_Symbol,PERIOD_CURRENT,j)*1.0;
         sumPV += price*volume;
         sumVol+=volume;

        }
      vwap[i]=  sumPV/sumVol;

      ChartRedraw();
     }


  }
//+------------------------------------------------------------------+

string nameline="nameline";

//+------------------------------------------------------------------+
//|                                                                  |
//+------------------------------------------------------------------+
bool LineCreate(
   const string          name="VLine",
   datetime              time=0,
   const color           clr=clrBlueViolet)

  {

   const ENUM_LINE_STYLE style=STYLE_DASHDOTDOT; // line style
   const int             width=1;
   const bool            back=false;
   const bool            selection=false;
   const bool            ray=true;
   const bool            hidden=true;
   const long            z_order=0;;
   const long            chart_ID=0;
   const int             sub_window=0;


//--- if the line time is not set, draw it via the last bar
   if(!time)
      time=TimeCurrent();
//--- reset the error value
   ResetLastError();
//--- create a vertical line
   if(!ObjectCreate(chart_ID,name,OBJ_VLINE,sub_window,time,0))
     {
      Print(__FUNCTION__,
            ": failed to create a vertical line! Error code = ",GetLastError());
      return(false);
     }
//--- set line color
   ObjectSetInteger(chart_ID,name,OBJPROP_COLOR,clr);
//--- set line display style
   ObjectSetInteger(chart_ID,name,OBJPROP_STYLE,style);
//--- set line width
   ObjectSetInteger(chart_ID,name,OBJPROP_WIDTH,width);
//--- display in the foreground (false) or background (true)
   ObjectSetInteger(chart_ID,name,OBJPROP_BACK,back);
//--- enable (true) or disable (false) the mode of moving the line by mouse
//--- when creating a graphical object using ObjectCreate function, the object cannot be
//--- highlighted and moved by default. Inside this method, selection parameter
//--- is true by default making it possible to highlight and move the object
   ObjectSetInteger(chart_ID,name,OBJPROP_SELECTABLE,true);
   ObjectSetInteger(chart_ID,name,OBJPROP_SELECTED,selection);
//--- enable (true) or disable (false) the mode of displaying the line in the chart subwindows
   ObjectSetInteger(chart_ID,name,OBJPROP_RAY,ray);
//--- hide (true) or display (false) graphical object name in the object list
   ObjectSetInteger(chart_ID,name,OBJPROP_HIDDEN,hidden);
//--- set the priority for receiving the event of a mouse click in the chart
   ObjectSetInteger(chart_ID,name,OBJPROP_ZORDER,z_order);
//--- successful execution
   return(true);
  }
//+------------------------------------------------------------------+


//+------------------------------------------------------------------+
//|                                                                  |
//+------------------------------------------------------------------+
void OnChartEvent(const int id,const long& lparam,const double& dparam,const string& sparam)
  {

   if(id==CHARTEVENT_OBJECT_DRAG && sparam == nameline) 
      anchor = ObjectGetInteger(0,nameline,OBJPROP_TIME);


  }


//+------------------------------------------------------------------+

//+------------------------------------------------------------------+
 
void function()
  {
   int bar = iBarShift(_Symbol,PERIOD_CURRENT,anchor);
 
   for(int i =0;i<bar;i++)
     {
      double sumPV=0;
      double sumVol=0;

      for(int j=i;j<bar;j++)
        {
         double price  = (iClose(_Symbol,PERIOD_CURRENT,j)+iHigh(_Symbol,PERIOD_CURRENT,j)+iLow(_Symbol,PERIOD_CURRENT,j))/3;
         double volume = iTickVolume(_Symbol,PERIOD_CURRENT,j)*1.0;
         sumPV += price*volume;
         sumVol+=volume;

        }
      vwap[i]=  sumPV/sumVol;

      ChartRedraw();
     }

   for(int i =bars;i<rates_total;i++)
     {
      vwap[i]=  EMPTY_VALUE;
     }


  }
 
Yashar Seyyedin #:
So simple … thanks a lot