Not the Grail, just a regular one - Bablokos!!! - page 447
You are missing trading opportunities:
- Free trading apps
- Over 8,000 signals for copying
- Economic news for exploring financial markets
Registration
Log in
You agree to website policy and terms of use
If you do not have an account, please register
hedge
you can only see how it works on the real
on the demo is not clear
Hedge is a solid line here, the spread is great, it still has to collapse, so the signal is holding the same (henge sell, pound buy, possible GAP):
doughnuts/arbitrage }|{iv
don't switch.
;)
How's it going with the poundjena buy? Signal still holding?)
Grail.
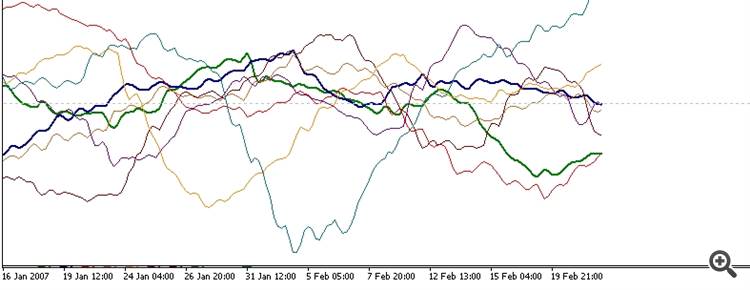
To start with, you need to build such an indicator:
There will only be one indicator curve in the indicator, and its value will be: the price difference of a currency pair and its major.
Then you need to make 7 such curves in the indicator. one for each major.
The indicator will be multi-currency. The value of each curve: is the price of a currency pair minus the sma of that currency pair.
Something like this:
The author seems to have taken the idea from Semen Semenych's cluster indicators:
https://www.mql5.com/ru/articles/1464
That's all!
Now we look at 2 extreme pairs, the highest and the lowest.
When they strongly diverge - we open deals on them in the direction of convergence. When indicator curves close - we close the deals.
The result of trading in this approach does not differ much.
Pairs should be equal in volume.
The yen has a value of 100.00, the euro has 1.000. The volatility of the yen chart will be 100 times higher.
We need to level all the legs.
How to do this? At the starting point, we divide all currency pairs by their quotes.
If the eurusd quote is 1.1300, then we divide the eurusd by this quote.
If the quotation of usdjpy is 100.12, then we divide usdjpy by 100.12.
That is, all indicator curves will exit from the same point, with a value of 1.
We open all transactions with the same volume: for $10,000.
For example:
How much usdchf should be opened for 10 000 dollars, if its quotation is 1.0100. Here the first place is a dollar, so 0.1 lot.
How much eurusd should be opened for 10 000 dollars if its quotation is 1.3000. The euro is in the first place here, so it should be divided by the price of the euro.
It turns out 10 000 / 1.3000 / (lot size 100 000) = 0.08 lot.
In some currency pairs dollar comes first. usdcad, usdchf, usdjpy.
We need to rotate all pairs in one direction, so that the dollar takes the second place in all of them.
Take pairs, in which the dollar is in the first position, in the indicator with a minus sign. It is taken into account when opening deals.
PS: the results on the system are so-so.
Felling the grail.
PS: the results on the system are so-so.____________________________________________________________________________________
Interesting
и
Humour
Interesting
и
Humour
you're off the hook, dude. fuck off)
You're off the hook, man. Fuck off.)
While we're at it, I'll give you another grail from Nekola:
Open a trade with a lot of 1% of the deposit. If it goes straight to the upside, we close it and clap our hands.
If it's in the red, we open the trade with a lot of 2%. If it is in the plus - we clap our hands.
If in minus - 4% and so on.
The results on the system are also so-so.
Ps: I can also tell you a very secret method called - anti-martini ... But that's only if the whole forum asks on their knees.
Grail.
First you need to build such an indicator:
There will only be one indicator curve in the indicator, and its value will be: the price difference of a currency pair and its major.
Then you need to make 7 such curves in the indicator. one for each major.
The indicator will be multi-currency. The value of each curve: is the price of a currency pair minus the sma of that currency pair.
Something like this:
The author seems to have taken the idea from Semen Semenych's cluster indicators:
https://www.mql5.com/ru/articles/1464
That's all!
Now we look at the 2 outermost pairs, the highest and the lowest.
When they strongly diverge - we open deals on them in the direction of convergence. When indicator curves close - we close the deals.
The result of trading in this approach does not differ much.
Pairs should be equal in volume.
The yen has a value of 100.00, the euro has 1.000. The volatility of the yen chart will be 100 times higher.
We need to level all the legs.
How do we do this? At the starting point, we divide all currency pairs by their quotes.
If the eurusd quote is 1.1300, then we divide the eurusd by this quote.
If the quotation of usdjpy is 100.12, then we divide usdjpy by 100.12.
That is, all indicator curves will exit from the same point, with a value of 1.
We open all transactions with the same volume: for $10,000.
For example:
How much usdchf should be opened for 10 000 dollars, if its quotation is 1.0100. Here the first place is a dollar, so 0.1 lot.
How much eurusd should be opened for 10 000 dollars if its quotation is 1.3000. The euro is in the first place here, so it should be divided by the price of the euro.
It turns out 10 000 / 1.3000 / (lot size 100 000) = 0.08 lots.
In some currency pairs dollar comes first. usdcad, usdchf, usdjpy.
We need to rotate all pairs in one direction, so that the dollar takes the second place in all of them.
Take pairs, in which the dollar is in the first position, in the indicator with a minus sign. It is taken into account when opening deals.
PS: the results on the system are so-so.
The difference between the price and the wrist, cool, you opened the MACD.... The same shit can be done on stochastics and RSI. The downside is that the collapse of an indicator does not always give profit. Stop messing with people's heads ... Nikolla, if you were a prophet, you would show online monitoring and not the gaals in the tester.
DidI open it? )))
Nicolla be a prophet, show online monitoring, not grails in the tester.
+++
The disadvantage is that the loss of an indicator will not always give a profit.
The slamming of the turkey does not at all mean that the equity of the pairs traded will be slammed, so it is more accurate.
The indicator will make the slop, but the spread will remain in the money.)
And then a new slop of the indicator and as if by chance the legs are wider out of the money ))
And that's where the averaging, martin and other stuff starts that leads to the logical conclusion ))) right between those spread legs ))
While we're at it, I'll give you another grail from Nekola:
Open a trade with a lot of 1% of the deposit. If it goes straight to the top - close it and clap your hands.
If it's in the red, we open the trade with a lot of 2%. If in the plus - we clap our hands.
If in minus - 4% and so on.
The results on the system are also so-so.
Ps: I can also tell you a very secret method called - anti-martini ... But that's only if the whole forum asks on their knees.