Not the Grail, just a regular one - Bablokos!!! - page 385
You are missing trading opportunities:
- Free trading apps
- Over 8,000 signals for copying
- Economic news for exploring financial markets
Registration
Log in
You agree to website policy and terms of use
If you do not have an account, please register
No - it's just that in the MT tester there is a model "by opening prices" - it processes the flow of All trades quite quickly - faster than potikovo - but this way - by Minutes or 5Minutes you run it and see what the results will be...
well i have 28, i already have one, by the way, without the losers.... and i told you i can do more, it doesn't change the strategy.
the intellectual hunger to move on.
you have a very good idea, but I remembered a plus dickfix which left a lot of unsolved puzzles
i hope that one of them we've been through today, namely how to get one pair through the other two
Thank you!the idea and implementation came quite a long time ago - when Semen Semenych was developing his cluster indicator
even then i was attracted by all those "splits" "skewers" - appearing on his turkeys...
and that you could pick something out of it
Well then came the legs and so on...
No - it's just that in MT tester there is a model "byopening prices" - it processes the flow of all trades rather quickly - faster than potiqo - but this way - you run it by Minutes or 5Minutes and see what the results will be...
Aleksander, OK, thanks for the reply.
By the way, it turns out that when you trade sell EUR , buy GBP (and cross between them), it's a part of pair trading... because sometimes they converge differently, i.e. EUR goes up, and GBP goes down. Sometimes it is more profitable to put GBP at the top, EUR at the bottom and cross in the middle (which will need to be mirrored). In the picture, one can see that depending on EUR and GBP direction, equity legs have different spreads.
The first indicator - sell EUR+cross buy and buy GBP+cross sell
the second indicator - sell GBP+cross sell and buy EUR+cross buy
Aleksander, OK, thanks for the reply.
By the way, it turns out that when one trades sell EUR , buy GBP (and cross between them), it is part of pair trading...because sometimes they converge otherwise, i.e. EUR goes up and GBP goes down. Sometimes it is more profitable to put GBP at the top, EUR at the bottom and cross in the middle (which will need to be mirrored). In the picture, one can see that depending on EUR and GBP direction, equity legs have different spreads.
The first indicator - sell EUR+cross buy and buy GBP+cross sell
the second indicator - sell GBP+cross sell and buy EUR+cross buy
They may use lot normalization to avoid the dependence of the swing from one direction or another :) somewhere they cut the wings for GBP or give an extra lot to EUR :)
For the spread not to depend strongly on the direction - they use lot normalization :) somewhere a pound is getting its wings trimmed or a Euro lot is getting an extra one :)
Exactly, after the balancing of lots the charts became more or less symmetrical :) However, on different days, less loss and better traill gives the upper and lower indicator (from the screenshot above). Still, there is a difference from change of the summands. :)
Exactly, after balancing the lots the charts became more or less symmetrical :) However, on different days, less lots and better traill gives the upper and lower indicator (from the screenshot above). Still, there is a difference from change of the summands. :)
so nobody forbids you to trade 4 legs at the same time :) - or just
alternately 1st and 2nd leg sell EUR+cross buy and buy GBP+cross sell
and separately, also alternately 3 and 4 - sell GBP+cross sell and buy EUR+cross buy - both independent of the first leg - and synchronized with the first leg :)
This way, you'll catch the tasty trash days more often :) and your deposit load will at least double :)
i don't get it, but i'm judging.
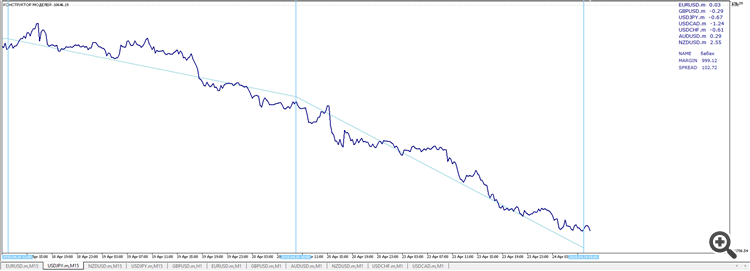
Hi :) portfolio builder :) - See if you have one - a trending portfolio - so that in a day... or 2 - 3 days giving a steady 100 pips up/down?
If you already have one, let me see a portfolio equity graph (without titles and lots :)) - On a 1M or 5M timeframe - may be compressed to show equity fluctuations (notches)...
Hi :) portfolio builder :) - See if you have one - a trending portfolio - so that in a day... or 2 - 3 days of steady 100 pips up / down?
If you have one, let me see a portfolio equity graph (even without specifying names and lots :) ) - on a 1M or 5M timeframe - may be compressed to show equity fluctuations (notches)...
for example, a portfolio that is falling ...
like a briefcase that falls ...