Fractal Wave For Forex Trading (and Stock Market Trading)
But you can do a Google search. And I can confirm it is based on fractals.
Hope this clarified
But you can do a Google search. And I can confirm it is based on fractals.
Hope this clarified
It seems it is your secret trading strategy. No problem at all.
It is understood. :)
Forum on trading, automated trading systems and testing trading strategies
Sergey Golubev, 2018.06.25 07:59
Usually zigzag is used as a filter. But zigzag is not simpe indicator. You may read it here:
Interpretation
The Zig Zag indicator is used primarily to help you see changes by punctuating the most significant reversals. It is very important to understand that the last "leg" displayed in a Zig Zag chart can change based on changes in the underlying plot (e.g., prices). This is the only indicator in this book where a change in the security's price can change a previous value of the indicator. Since the Zig Zag indicator can adjust its values based on subsequent changes in the underlying plot, it has perfect hindsight into what prices have done. Please don't try to create a trading system based on the Zig Zag indicator--its hindsight is much better than its foresight! In addition to identifying significant prices reversals, the Zig Zag indicator is also useful when doing Elliot Wave counts.
For additional information on the Zig Zag indicator, refer to Filtered Waves by Arthur Merrill.
and:
Elliott Wave Theory
The Elliott Wave Theory is named after Ralph Nelson Elliott. Inspired by the Dow Theory and by observations found throughout nature, Elliott concluded that the movement of the stock market could be predicted by observing and identifying a repetitive pattern of waves. In fact, Elliott believed that all of man's activities, not just the stock market, were influenced by these identifiable series of waves. With the help of C. J. Collins, Elliott's ideas received the attention of Wall Street in a series of articles published in Financial World magazine in 1939. During the 1950s and 1960s (after Elliott's passing), his work was advanced by Hamilton Bolton. In 1960, Bolton wrote Elliott Wave Principle--A Critical Appraisal. This was the first significant work since Elliott's passing. In 1978, Robert Prechter and A. J. Frost collaborated to write the book Elliott Wave Principle.
Interpretation
The underlying forces behind the Elliott Wave Theory are of building up and tearing down. The basic concepts of the Elliott Wave Theory are listed below. Action is followed by reaction. There are five waves in the direction of the main trend followed by three corrective waves (a "5-3" move). A 5-3 move completes a cycle. This 5-3 move then becomes two subdivisions of the next higher 5-3 wave. The underlying 5-3 pattern remains constant, though the time span of each may vary. The basic pattern is made up of eight waves (five up and three down) which are labeled 1, 2, 3, 4, 5, a, b, and c on the following chart. Waves 1, 3, and 5 are called impulse waves. Waves 2 and 4 are called corrective waves. Waves a, b, and c correct the main trend made by waves 1 through 5. The main trend is established by waves 1 through 5 and can be either up or down. Waves a, b, and c always move in the opposite direction of waves 1 through 5. Elliott Wave Theory holds that each wave within a wave count contains a complete 5-3 wave count of a smaller cycle. The longest wave count is called the Grand Supercycle. Grand Supercycle waves are comprised of Supercycles, and Supercycles are comprised of Cycles. This process continues into Primary, Intermediate, Minute, Minuette, and Sub-minuette waves.
As to me so I used zigzag in more simple way in Channel trading system: when I am losing money in manual trading so I start to trade channel trading system to recover deposit size https://www.mql5.com/en/forum/173261
So I am trying to be short here because no one like reading too much.
I will get into the main point straight away for your trading.
Then where is the winning opportunity for Forex Trading ?
This image below visualize such an opportunity.
Say that the market or even EURUSD has the large cycle and small cycle. Your best opportunity will be in the area where both small and large cycle are boosted together shown as the dotted line in the bottom of the image.
That is the thin intersaction where both experienced momentum trader and experienced reversal trader are jumping in.
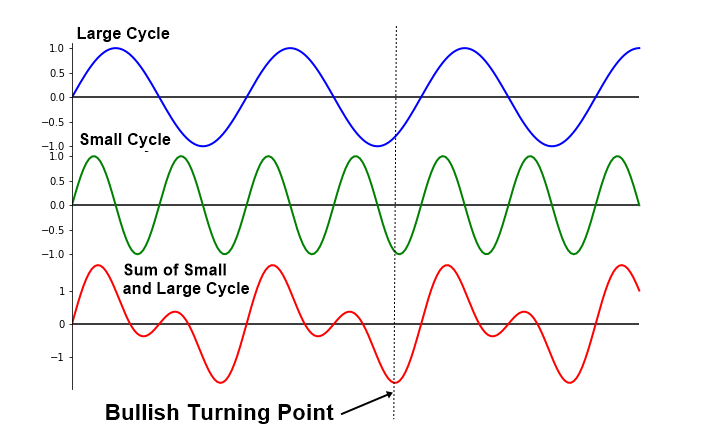
There is one problem in the above image although its concept is perfectly sound.
For example, the market does not have the deterimistic cycle which we can track its peak and trough with fixed time interval as in the sine curve of the Physics text book (Above image is only educational to conceptualize the trading idea.).
If it was like that, the money making in Forex or Stock market would have been so much easier buying EURUSD on Monday low and selling at Friday high something like this or similar.
In fact, what makes us hard is that the market cycle is non deterministic or stochastic.
Market cycle is fuzzy and dirty like the image below. Sometimes, price is in slow cycle and sometimes price in fast cycle.
Sometimes, price swings around big amplitude and sometimes, price swings around only small amplitude.
It is the observations we can make everyday in Forex and Stock market, fuzzy and dirty cycles instread of the clean sine curve like cycle.

Here is the main catch. Fractal Wave is the representation of this fuzzy and dirty cycles in the financial market.

Hence, the Fractal Wave derived technical anlaysis like below is good help in finding the right timing to enter the market. In fact, these are the timing tool for your trading in the first hand.
- Horizontal and Diagonal Support and Resistance
- Fibonacci Ratio analysis
- Harmonic Pattern
- Elliott Wave Theory
- X3 Chart Pattern Framework
- Symmetrical Triangle
- Ascending Triangle Pattern
- Descending Triangle Pattern
- Falling Wedge Pattern
- Rising Wedge Pattern
- Channel
- Supply and Demand Zone
- Renko Chart
- Point & Figure Chart
- Double Top
- Double Bottom
- Triple Top
- Triple Bottom
- Head and Shoulder pattern
- Reverse Head and Shoulder pattern
- Many Swing Trading Strategis
- Peak Trough Analysis
- ABC or 123 pattern
- and many more

- www.mql5.com
Now, let us going back to this educational image as we have some more points to add.
Technically speaking, the good trading opportunity will be there where small and large cycles are boosted together.
Then starter will have the question something like this: Then how to find opportunity like this where small and large cycles are boosted together in the Fractal Wave way ?
In the Fractal Wave way, catching the moment where the small and large cycles are boosted together is done by combining more than two techniques to gauge your entry instead of just using one single technique.
Hence, if you want to become a good trader, then training and practice are a must requirement.

As you know, when you go to the internet for forex trading, there are a lot of articles, which can confuse the traders.
Sometimes, there are successful traders out there but they can not explain how and why they were become successful with their trading.
Hence, I am trying to help you to get the right idea to start for your trading.
Especially, about Fractal Wave, there are not too much information on the internet.
However, as you can see, it is one practical theory which you can explain the winning opportunity in the short and simple explanation.
One Final Note
As the market is non determinstic meaning that the market only follows the probabilistic cycle, your outcome is not going to be bullet proof.
Therefore, we rather say that the high probabilty trading setup or high probability trading opportunity in our trading.
So, we have outlined the most important question for Forex trading in the previous posts about "Where is the winning opportunity in Forex trading?"
Now, the concept of the winning opportunity shoud be clear to every trader.
How to bring the concept into the practice ? We certainly need some tools for our analysis as the mathematical algorithm or software are the proof of the concept.
Therefore, next newbie's question is "how do we start with the technical anlaysis derived from fractal wave like support, resistance, harmonic pattern, elliott wave theory, supply, demand zone, and so on ?
Peak Trough Analysis
We start up the anlaysis with peak trough analysis (or peak trough transformation).
That is the mathematical transformation, which turns the price series into fractal wave.
Let us even say simpler. Simply speaking, it just picks up the peak and trough in alternation. That is it. This simple math trick transform the price series into Fractal wave feature space.

When the peak trough transformation is done, any three points in the chart will turn into one triangle like this.
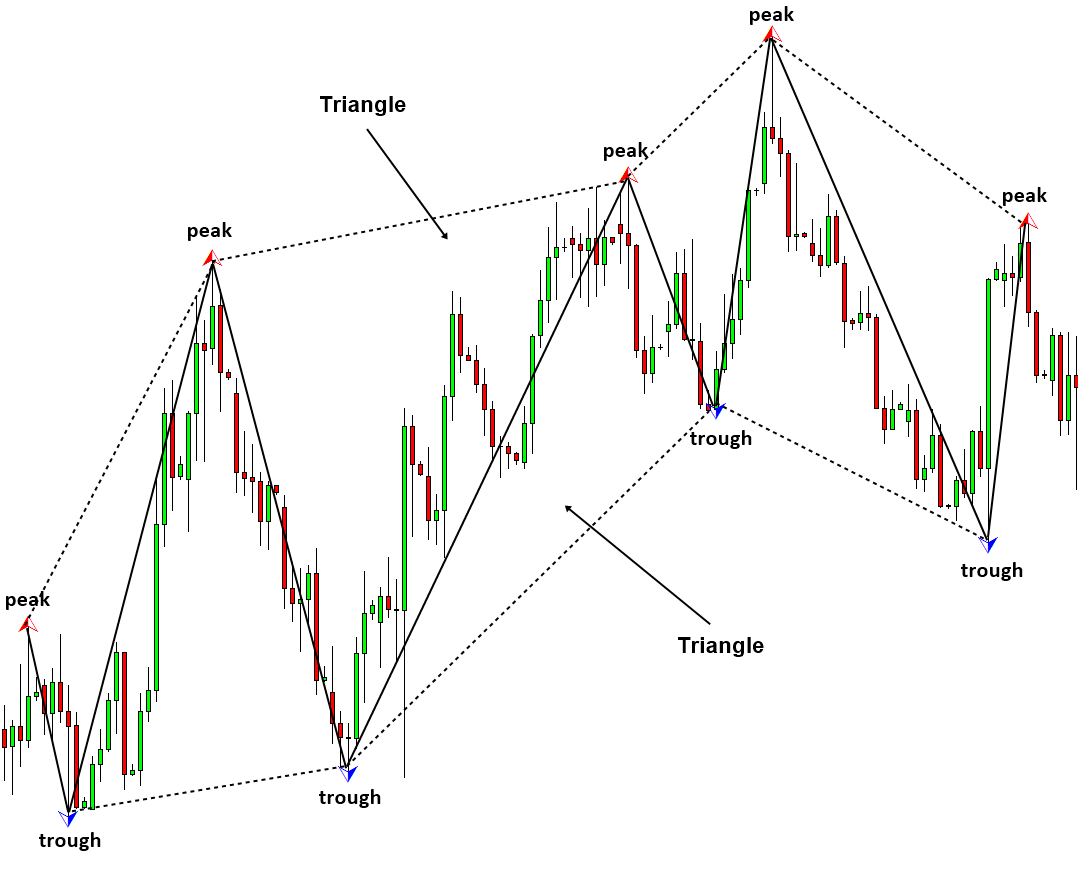
This is the starting point for any of the technical anlaysis derived from Fractal Wave.
If you are the mathematical person, then you can view the peak trough transformation as the similar technqiue to fourier transformation or wavelet anlaysis or principal componental analysis and so on.
Just the difference is that peak trough transformation is designed to work with stochasics cycles whereas the other techniques are deisigned to work with more of deterministic cycles.
Then how to perform the peak trough transformation ? There are several technqiues are known to do such a transformation. Currently three viable techniques are like below:
1. ZigZag Indicator
2. Renko Chart
3. Mathematical interpolation
4. Some other techniques might be there too
ZigZag indicator and Renko chart are the popular in the trading community. Mathematical interpolation was used by Benoit Mandelbrot in his paper, the Godfather of Fractal Theory.
Here are some example of the techncial anlaysis with peak trough transforamtion
1. You can simply detect support or resistance by connecting serveral of these points in your chart (ratio checks are not required)
2. By combining one support and resistance, you can detect triangle, rising wedge, falling wedge and channel patterns. (ratio checks are not required)
3. You can detect fibonacci price pattern like 0.618 ratio 1.618 ratio pattern by connecting three points (ratio checks are required)
4. You can detect harmonic pattern by connecting four or five of these points (ratio checks are required)
5. You can detect Elliott Wave 12345 pattern by connecting six of these points (ratio checks are required)
6. You can detect any other Elliott Wave pattern by connecting several of these points (ratio checks are required)
7. And so on (There are almost endless examples.)
Advantage of the technical anlaysis derived from Fractal Wave
You can trade what you see. Such technical analysis are fully aligned with your own intuition. Plus they provide the totally transparent trading opportunity as you will trade from price to price in the chart as they are.
Disadvantage of the technical anlaysis derived from Fractal Wave
It might be harder to code when you want to make these techniques for the automation. For example, the automation of the technical anlaysis derived from fractal wave is nearly same as putting human's visual interpretion capability into the chart.
I hope this introductory information clears up many questions and confusions, if you had any, about all these technical analysis techniques.
- Free trading apps
- Over 8,000 signals for copying
- Economic news for exploring financial markets
You agree to website policy and terms of use
Fractal Wave is by far the most conformative and practical theory in the technical analysis. However, it is also most underestimated theory too. In my opinion, ironically, this important theory is less popular.
Hence, I decided to bring some educational materials here in the direction of making the mql5.com community more capable and knowledgable.
Some of the seasoned traders probably found that there is only little information about Fractal Wave on the internet but they probably have a lot to talk about Fractal Wave from their trading experience.
I really believe that having this outstanding topic in mql5.com forum is good in terms of increasing healthy traffics among the competing website forums.
So I hope we can continue some constructive discussion here with respect to all participants.
=========================================================================================================================================================
So where to start ?
Fractal Wave is the core theory behind many important trading strategy like below:
Almost countless trading strategies uses the Fractal Wave in its core concept. You can consider these techncial analysis are derived from Fractal Wave.
Now, you might use any of above technical analysis everyday. But you might never heard of Fractal Wave before. :)
That is the exact reason I brought this topic here.
I really hope that understanding this core theory can improve your forex trading in many ways.
So let us begin.