Join our fan page
- Views:
- 15200
- Rating:
- Published:
- 2008.11.24 09:08
- Updated:
- 2014.04.21 14:53
-
 You are missing trading opportunities:
- Free trading apps
- Over 8,000 signals for copying
- Economic news for exploring financial markets
Registration Log inYou agree to website policy and terms of use
If you do not have an account, please register
-
 Need a robot or indicator based on this code? Order it on Freelance
Go to Freelance
Need a robot or indicator based on this code? Order it on Freelance
Go to Freelance
In my opinion, the method described by Sator has a right for the further continuation.
The MUV% indicator calculates the current position between the maximum and minimum within the KPeriod period using the calling of the MUV.
At that, there is a possibility to use both the difference between the current and the previous value of the MUV and its value itself.
Parameters:
- MAPeriod = 14; the period of the MUV indicator;
- MUV KPeriod = 14; the period of calculation of the minimum and maximum;
- ShowDif = true; show the indicator by the difference;
- ShowMUV = true; show the indicator by the value;
The MUV_Diff indicator is just the difference of the MUV values.
Parameters:
MAPeriod = 14; the period of the MUV indicator;
SMA and EMA are used in both indicators.
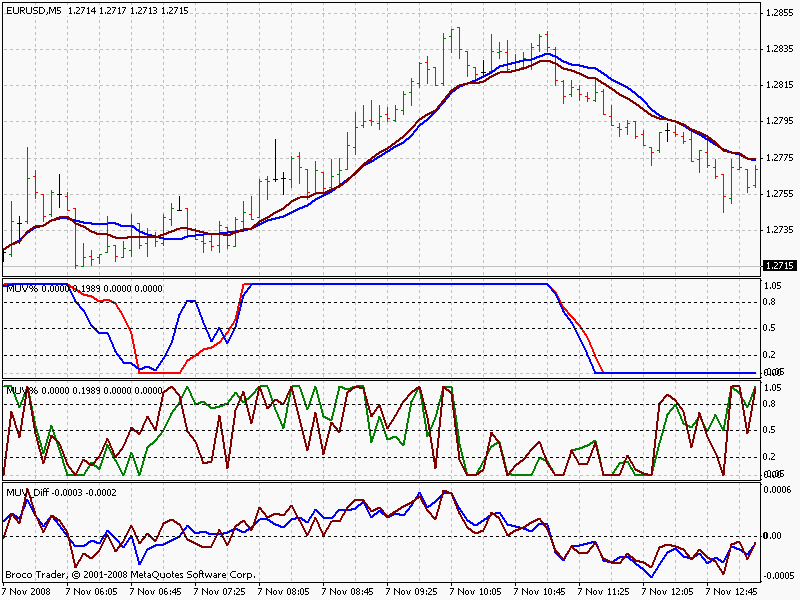
On the chart: the MUV with 0 and 1 methods.
The next one is the MUV% with disabled ShowDif.
Then comes the MUV% with disabled ShowMUV.
And the last one is the MUV_Diff.
Translated from Russian by MetaQuotes Ltd.
Original code: https://www.mql5.com/ru/code/8549
 MultiZigZag - Another Variant of ZigZag (Economic ZigZag)
This version of ZigZag can simultaneously display three zigzags both drawn on the data from the current timeframe and on the data from the larger timeframes.
 Percenter.mqh - Calculator-Script
The script is the calculator of the simple, complex, nominal and continuously charged percents.
Price Action Indicator
This indicator plots in the chart base on the tick price , ie. when the price moves down 10 pips it plots the down candle and wait till the next 10 pips if move up 10 pips it plots the up candle with the other color candle to indicate the up down price
 A System: Championship 2008 Revised Edit
Automatic Trading System