Join our fan page
- Views:
- 55059
- Rating:
- Published:
- 2005.11.29 11:55
- Updated:
- 2016.11.22 07:32
-
Need a robot or indicator based on this code? Order it on Freelance Go to Freelance
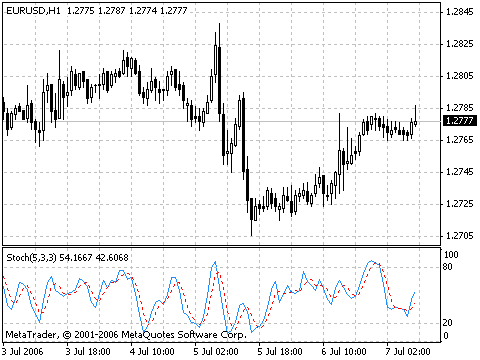
The Stochastic Oscillator Technical Indicator compares where a security’s price closed relative to its price range over a given time period.
The Stochastic Oscillator is displayed as two lines. The main line is called %K. The second line, called %D, is a Moving Average of %K. The %K line is usually displayed as a solid line and the %D line is usually displayed as a dotted line.
There are several ways to interpret a Stochastic Oscillator. Three popular methods include:
-
Buy when the Oscillator (either %K or %D) falls below a specific level (e.g., 20) and then rises above that level. Sell when the Oscillator rises above a specific level (e.g., 80) and then falls below that level;
-
Buy when the %K line rises above the %D line and sell when the %K line falls below the %D line;
-
Look for divergences. For instance: where prices are making a series of new highs and the Stochastic Oscillator is failing to surpass its previous highs.
Calculation
The Stochastic Oscillator has three variables:
-
%K periods (Pk). This is the number of time periods used in %K calculation. By default is 5;
-
%K Slowing Periods (Sk). This value controls the internal smoothing of %K. A value of 1 is considered a fast stochastic; a value of 3 is considered a slow stochastic. By default is 3;
-
%D periods (Pd). This is the number of time periods used when calculating a moving average of %K. By default is 3;
The formula for %K is:
%K = 100*SUM (CLOSE - MIN (LOW, Pk), Sk) / SUM (MAX (HIGH, Pk) - MIN (LOW, Pk)), Sk)
Where:
- CLOSE — is today’s closing price;
- MIN (LOW, Pk) — is the lowest low in Pk periods;
- MAX (HIGH, Pk) — is the highest high in Pk periods;
- SUM (CLOSE - MIN (LOW, Pk), Sk) — amount composed CLOSE - MIN (LOW, Pk) for period Sk;
- SUM (MAX (HIGH, Pk) - MIN (LOW, Pk)), Sk) — amount composed HIGH (Pk)) - MIN (LOW, Pk) for period Sk.
The %D moving average is calculated according to the formula:
%D = SMA (%K, Pd)
where:
- Pd — is the smoothing period for %K;
- SMA — is the Simple Moving Average.

Technical Indicator Description
Full description of Stochastic is available in the Technical analysis: Stochastic Oscillator
Translated from Russian by MetaQuotes Ltd.
Original code: https://www.mql5.com/ru/code/7792
 Relative Strength Index (RSI)
The Relative Strength Index (RSI) technical indicator is a price-following oscillator that ranges between 0 and 100.
 Parabolic SAR, Parabolic
Parabolic SAR Indicator was developed for analyzing the trending markets.
