Join our fan page
- Views:
- 7407
- Rating:
- Published:
- 2018.06.25 12:31
-
 You are missing trading opportunities:
- Free trading apps
- Over 8,000 signals for copying
- Economic news for exploring financial markets
Registration Log inYou agree to website policy and terms of use
If you do not have an account, please register
-
 Need a robot or indicator based on this code? Order it on Freelance
Go to Freelance
Need a robot or indicator based on this code? Order it on Freelance
Go to Freelance
The U.S. Dollar Index (USDX, DXY, DX) is an index (or measure) of the value of the United States dollar relative to a basket of foreign currencies, often referred to as a basket of U.S. trade partners' currencies. The Index goes up when the U.S. dollar gains "strength" (value) when compared to other currencies.
The index is maintained and published by ICE (Intercontinental Exchange, Inc.), with the name "U.S. Dollar Index" a registered trademark.
It is a weighted geometric mean of the dollar's value relative to following select currencies:
- Euro (EUR), 57.6% weight.
- Japanese yen (JPY) 13.6% weight.
- Pound sterling (GBP), 11.9% weight.
- Canadian dollar (CAD), 9.1% weight.
- Swedish krona (SEK), 4.2% weight.
- Swiss franc (CHF) 3.6% weight.
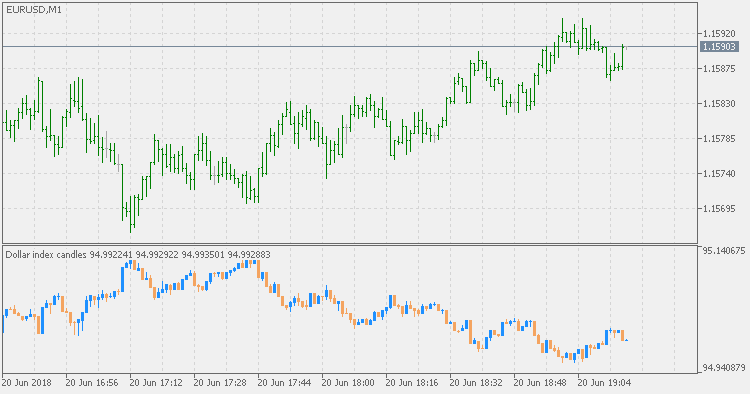
Compared to the Dollar Index indicator, this version is a bit different: instead of showing just one value, it is displaying the "open", "close", "high" and "low" of dollar index as candles in a separate window. That way you can see the volatility of the dollar index intra bar change too and it displays values closer to our normal assumption how the index is formed.
 Dollar Index
The U.S. Dollar Index (USDX, DXY, DX) is an index (or measure) of the value of the United States dollar relative to a basket of foreign currencies, often referred to as a basket of U.S. trade partners' currencies. The Index goes up when the U.S. dollar gains "strength" (value) when compared to other currencies.
Repulse Multi Timeframe
The Repulse Multi Timeframe indicator measures and displays the bullish or bearish pressure associated with each price candlestick in the form of a curve.
Volatility Pivot
Volatility Pivot indicator calculates "pivots" (support/resistance lines) based on current symbol/timeframe Average True Range calculated volatility.
Step Chart
Step Chart indicator monitors the price change (in pips) and according to that, determines if a new "step" has been made or not.