Join our fan page
- Views:
- 3527
- Rating:
- Published:
- 2018.04.13 12:53
-
 You are missing trading opportunities:
- Free trading apps
- Over 8,000 signals for copying
- Economic news for exploring financial markets
Registration Log inYou agree to website policy and terms of use
If you do not have an account, please register
-
 Need a robot or indicator based on this code? Order it on Freelance
Go to Freelance
Need a robot or indicator based on this code? Order it on Freelance
Go to Freelance
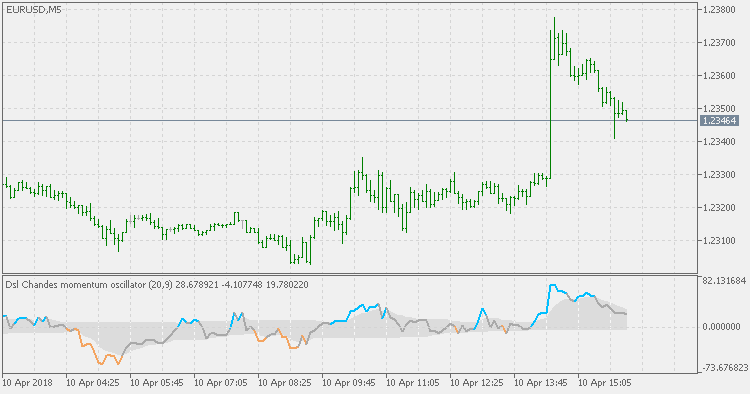
The Chande Momentum Oscillator is a technical momentum indicator invented by Tushar Chande. Chande introduced the indicator in his 1994 book "The New Technical Trader". It is created by calculating the difference between the sum of all recent gains and the sum of all recent losses and then dividing the result by the sum of all price movement over the period.
The Chande Momentum Oscillator formula is:
where:
- Su - sum of gains.
- Sd - sum of losses.
Usually CMO is used compared to static levels (usually levels -50 and +50), but that approach lacks flexibility and often lags. This version attempt to change that by adding Discontinued Signal Lines instead of using static levels for trends.
 Schaff Trend Cycle - TEMA
Unlike the original Schaff Trend Cycle, this version is using TEMA MACD for calculation, which makes it "faster" in determining (even compared to DEMA version) the trend changes and thus producing signals a few bars earlier.
Schaff Trend Cycle - DEMA
Unlike the original Schaff Trend Cycle, this version is using DEMA MACD for calculation, which makes it "faster" in determining the trend changes and thus producing signals a few bars earlier (which can be significant in "scalping" systems).
Dsl - CMO bars
Chande Momentum Oscillator with added Discontinued Signal Lines instead of using static levels for trends displayed on the main chart as bars (if the current chart style is bars or line) or candles (it is done automatically).
Congestion index
The Congestion Index attempts to identify the market's character by dividing the actual percentage that the market has changed in the past x days by the extreme range.