Join our fan page
- Views:
- 7038
- Rating:
- Published:
- 2018.04.10 14:20
-
 You are missing trading opportunities:
- Free trading apps
- Over 8,000 signals for copying
- Economic news for exploring financial markets
Registration Log inYou agree to website policy and terms of use
If you do not have an account, please register
-
 Need a robot or indicator based on this code? Order it on Freelance
Go to Freelance
Need a robot or indicator based on this code? Order it on Freelance
Go to Freelance
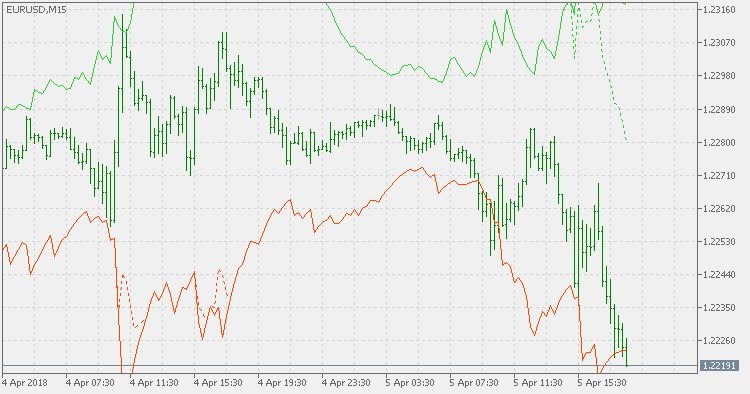
In his TASC April 2008 article, François Bertrand describes a "what-if" RSI indicator: what should be the price so that some target RSI level would be reached.
The indicator helps in multiple ways, but mainly in visualizing on the main chart what price change would trigger the expected overbought or oversold signals. Being on the main chart it is very easy to assess is the price change is realistic or it is far from being close to what is needed for signal and hence, far from signaling trend change.
 Renko 2.0 ATR
This non-trading utility generates custom symbol information on 1M chart.
 Stochastic RSI
This version of Stochastic RSI uses a sort of a signal line to make it even more sensitive.
Triple Hull
The indicator is using 3 instances of Hull Moving Average.
RSI of Hull
The Relative Strength Index (RSI) is a momentum indicator developed by noted technical analyst Welles Wilder, that compares the magnitude of recent gains and losses over a specified time period to measure speed and change of price movements of a security. It is primarily used to attempt to identify overbought or oversold conditions in the trading of an asset.