Join our fan page

ClearView - PricePointer, RoundNumberMarker, PeriodSeparator plus template - indicator for MetaTrader 5
- Views:
- 37121
- Rating:
- Published:
- Updated:
-
Need a robot or indicator based on this code? Order it on Freelance Go to Freelance
This is a set of three indicators to enhance the look of your charts. Use it instead of the default 'Show grid' from the chart properties menu. A template to quickly load all three is also included. These indicators may be more useful for manual or hybrid trading but even for automated trading they could provide visual clues for optimization of the system.
The idea behind the indicators is that people have a tendency to set targets and stops on or near round numbers (50/100/500/1000 pips) on the chart and historical highs and lows. As a result these price points can become support or resistance areas. These indicators show clearly when price is near any of these points.
When loading the indicators, allow time for the terminal to update the history for the current chart and to retrieve data from the monthly chart.
The default color sets are optimized for use on a black background.
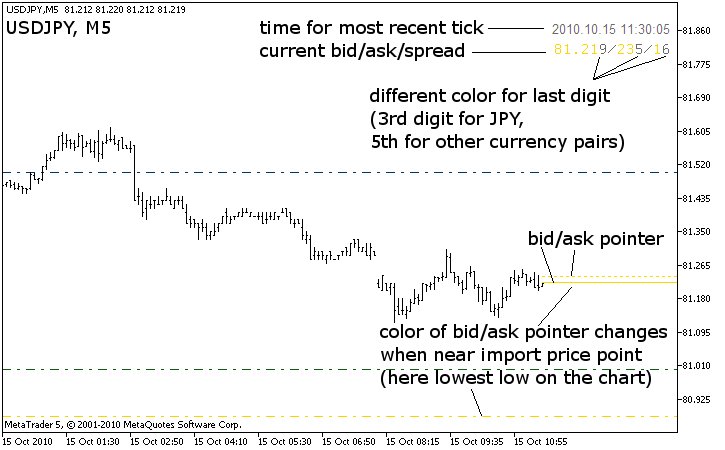
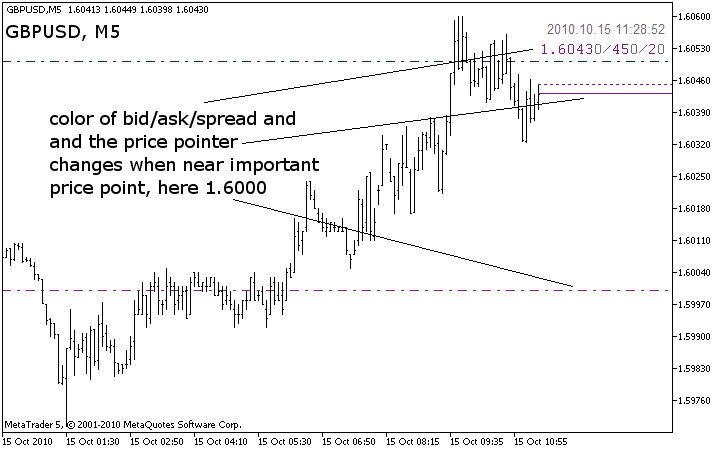
ClearView_PricePointer: bid/ask pointer with color-coded alerts every 500/1000 pips, daily high/low, high/low on the chart, historical high/low, shows last bid/ask/spread/tick-time
- Option to have high/low for the current chart and the historical high/low for the currency printed upon loading the indicator
- Option to set historical high/low manually in case your data-provider doesn't have deep enough history
- Turn on/off bid and ask lines separately
- Extend bid/ask lines to the start of the chart or just to the latest bar
- Bid/ask lines change color when near an important price point (500/1000 pips, daily high/low, high/low on the chart, historical high/low)
- Set how many pips before important price points the color of bid/ask lines should change (value is set in 4-digit pips, e.g. difference between 1.30104 and 1.30204 is 10 pips)
- Option to have the last (5th) digit in bid/ask/spread colored differently for clarity
- Set the corner where to show the bid/ask/spread/time of last tick
- Show the bid/ask/spread/time in the main window (default) or in another subwindow of the same chart
- NOTE: when using ClearView_PricePointer shift the chart for better visibility (check the box 'Chart shift' on the 'Common' tab of the chart properties)
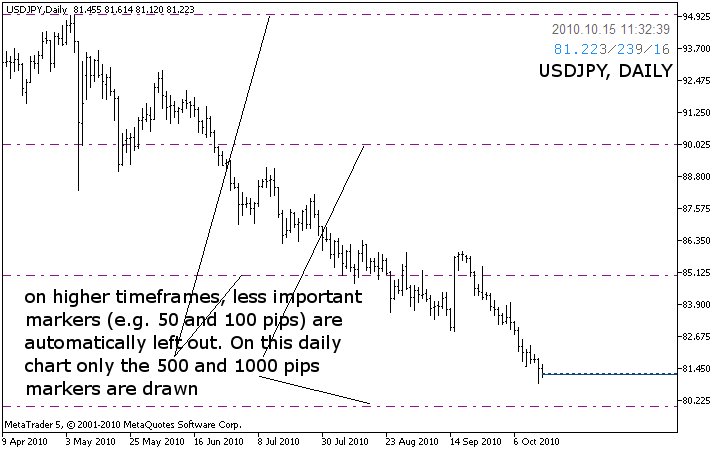
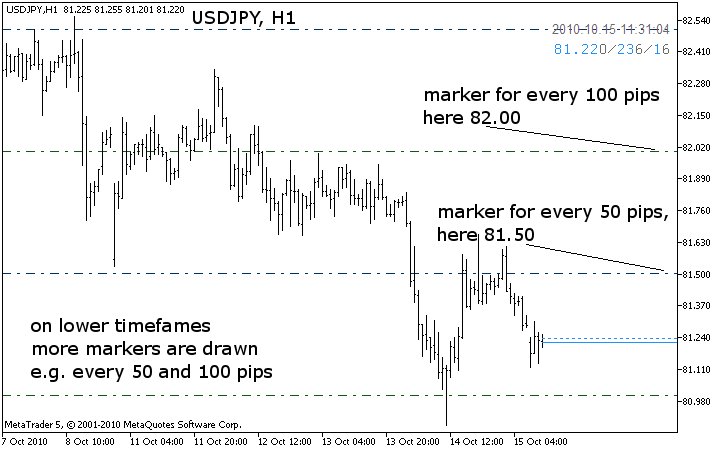
ClearView_RoundNumberMarker: draws markers for every 50/100/500/1000 pips, high/low on the chart, historical high/low
- Choose between two color sets (bright or dim colors) to set the visibility of the lines drawn
- Draw lines as background (default and recommended) or on foreground
- Option to have high/low for the current chart and the historical high/low for the currency printed upon loading the indicator
- Option to set historical high/low manually in case your data-provider doesn't have deep enough history
- When historical high/low, or high/low on chart is hit by price, it marks this point as a possible support/resistance area while also showing the new high/low. NOTE: you can easily see how this works by manually setting the historical high/low to a price only a few pips from the current price. Then wait for price to hit the high/low and see how the lines split to mark the previous high/low and the current high/low.
- Set how long this previous high/low price point should remain marked (default=1 day). NOTE: if you change timeframe or reload the chart or the indicator this information is lost.
- Specify for each marker up to which timeframe it should be shown. E.g. you can choose to show 100 pip markers (EURUSD 1.3000, 1.3100 etc) only up to the 1-hour timeframe. This way your chart won't be cluttered with too many lines when switching between timeframes. On any timeframe it will automatically show only the lines you want to see.
- Apart from different colors, all markers have an object description to show whether it's marking 50 pips, a 100, 500, 1000 pips, the chart's (previous) high/low or the (previous) historical high/low.
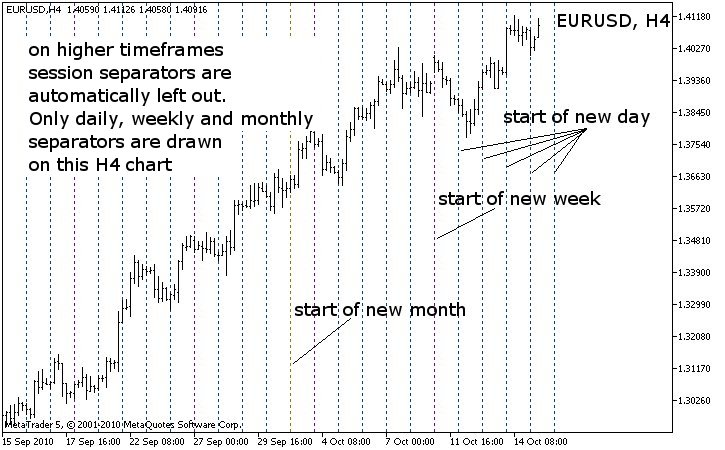
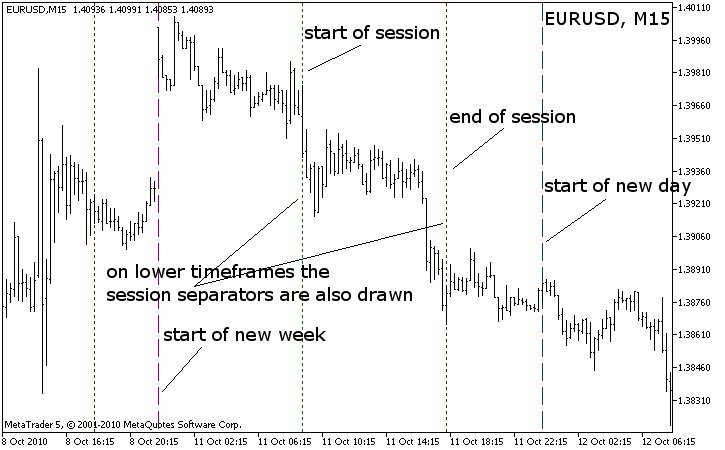
ClearView_PeriodSeparator: period separator to mark days, weeks, months and custom session start/end
- Choose between two color sets (bright or dim colors) to set the visibility of the lines drawn
- Draw lines as background (default and recommended) or on foreground
- Specify a custom start and end time to mark your trading hours
- Specify for each marker whether it should be shown at all (true/false) and up to which timeframe. E.g. you can choose to show daily markers only up to the 1-hour timeframe. This way your chart won't be cluttered with too many lines when switching between timeframes. On any timeframe it will automatically show only the lines you want to see.
- Apart from different colors, all markers have an object description to show whether it's the start/end of a session, day (includes three letter abbreviation for day of the week), week, month or year.
- Start and end of session and new day markers are projected into the future to give an indication how much time is left (if they're not visible, zoom out to see these markers)
ClearView_ChartTemplate: a template to quickly load the three indicators above.
- NOTE: The template looks for the indicators in the default folder /MQL5/Indicators
The images below are on a white background and some of the colors may not show well because the default colors of the indicators are optimized for use on a black background. However, all colors can be changed in the indicator properties to suit any background color you like.
ClearView_PricePointer
ClearView_RoundNumberMarker
ClearView_PeriodSeparator
 s-LastPinkEventDate
Since Terminal build 344 added display of economic calendar news using special graphical objects (OBJ_EVENT). A script that outputs as a demonstration of the Economic Calendar with current economic data, the date of the last major (Pink) event.
 2MA_RSI
This Expert Advisor uses two Moving Averages and RSI indicator.
 i-OrdersMQL5
The indicator shows deals history on the chart.
 Adaptive Moving Average with Bollinger Bands ®
The indicator shows the trend and allows to see a price range.