Join our fan page
- Views:
- 5240
- Rating:
- Published:
- 2018.04.18 17:18
-
 You are missing trading opportunities:
- Free trading apps
- Over 8,000 signals for copying
- Economic news for exploring financial markets
Registration Log inYou agree to website policy and terms of use
If you do not have an account, please register
-
 Need a robot or indicator based on this code? Order it on Freelance
Go to Freelance
Need a robot or indicator based on this code? Order it on Freelance
Go to Freelance
The indicator adds signal arrows on the specified day of the week and time:
- If the Close price of a candlestick preceding the given one is lower than the Open price of the specified day of the week, then an up arrow is drawn at the given candlestick;
- If the Close price of a candlestick preceding the given one is higher than the Open price of the specified day of the week, then a down arrow is drawn at the given candlestick;
The indicator allows selecting the day of the week and the hour of that day to check, so it has two configurable parameters:
- Day of week - the day of the week to check;
- Hour of day - the hour of the day.
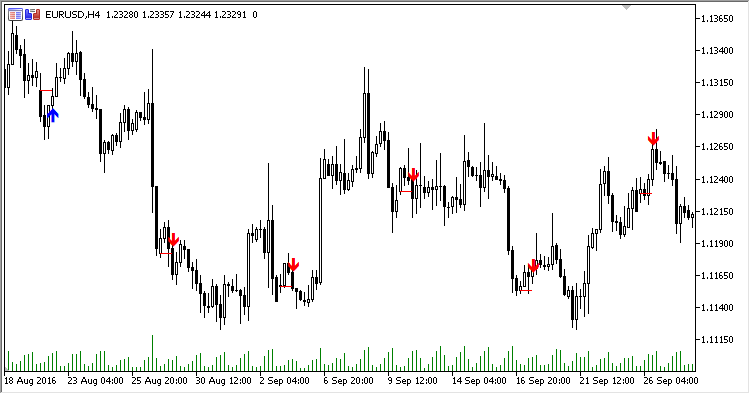
Fig.1 H4, Monday, 8 hours
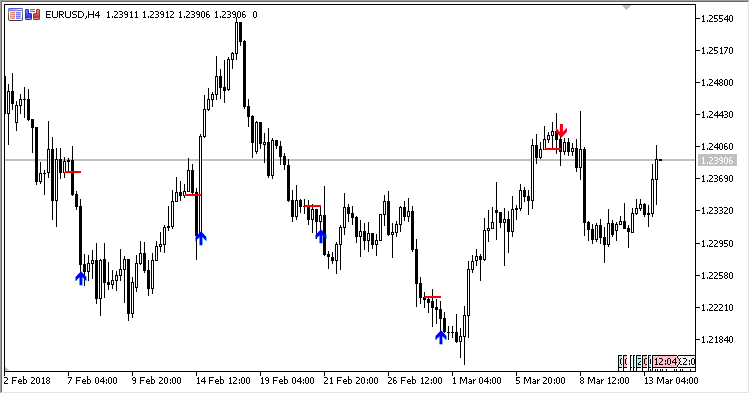
Fig.2 H4, Monday, 16 hours
Translated from Russian by MetaQuotes Ltd.
Original code: https://www.mql5.com/ru/code/20205
 Parabolic_TrailingStop
A utility for applying trailing stop based on the "Parabolic SAR" indicator.
Aeron JJN Scalper EA
The Expert Advisor places pending Buy Stop and Sell Stop orders. Includes checks for the minimum distance of orders in points (SYMBOL_TRADE_STOPS_LEVEL).
 Days of the week color
A colored histogram of the days of the week. Uses the drawing style DRAW_COLOR_HISTOGRAM.
SV v.4.2.5
The Expert Advisor opens no more than one position per day. Positions are opened at the specified time. It searches for the Highest and Lowest price in an interval. Data of two iMA (Moving Average, MA) indicators are used.