Join our fan page
- Views:
- 9082
- Rating:
- Published:
- 2017.01.26 09:11
-
 You are missing trading opportunities:
- Free trading apps
- Over 8,000 signals for copying
- Economic news for exploring financial markets
Registration Log inYou agree to website policy and terms of use
If you do not have an account, please register
-
 Need a robot or indicator based on this code? Order it on Freelance
Go to Freelance
Need a robot or indicator based on this code? Order it on Freelance
Go to Freelance
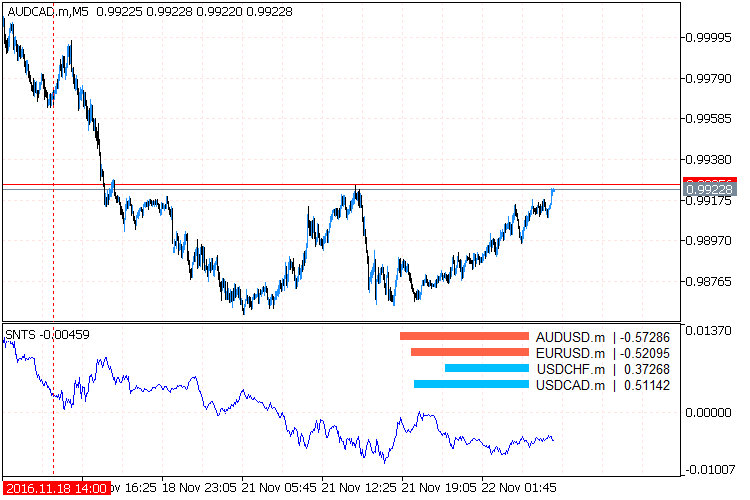
Indicator for automatic selection of the coefficients for every instrument in a pseudo-stationary portfolio, which tends to equilibrium at zero.
The indicator requires the presence of the AlgLib library in the Include\Math folder of the terminal.
A Bit of Theory
Every instrument moves in its own direction, every direction is a separate dimension in a multidimensional array. Bu turning the matrix, that is, by multiplying its every element by a certain number, we try to find an axis, with the minimum distance the axis and all instruments, i.e. the least total variance. The number to multiply each element of the matrix then becomes the angle value, by which the moving instrument should be turned so that it moves in the same direction as other instruments. This angle value is the coefficient for every currency in the portfolio.
If the coefficient value is greater than 0 the currency is bought, if less than 0 — sold. Thus, it is possible to sustain the stationarity of the created synthetic by recalculating the coefficients from time to time. In addition, the PCA does not simply find the axis with the least variance for the portfolio, but several. The number of instruments in the portfolio is the number of components (vectors). Each of them is called the main component, and determines how much it affects the total change of the portfolio movement.
Possible problems
If the chart is not drawn, see what is printed in the Experts tab. Perhaps, there are some errors or synchronizations with other charts is in progress. If there are no messages, click through other timeframes.
The obtained vector values were verified with the once calculated in the R package, so the values themselves are correct. But the sign of a specific coefficient may be wrong, as the РСА does not pay attention to signs. The "-" or "+" sign can only be determined empirically, that is by trial and error.
Problem #2 with has been describes with the pictures here: http://stats.stackexchange.com/questions/34396/im-getting-jumpy-loadings-in-rollapply-pca-in-r-can-i-fix-it
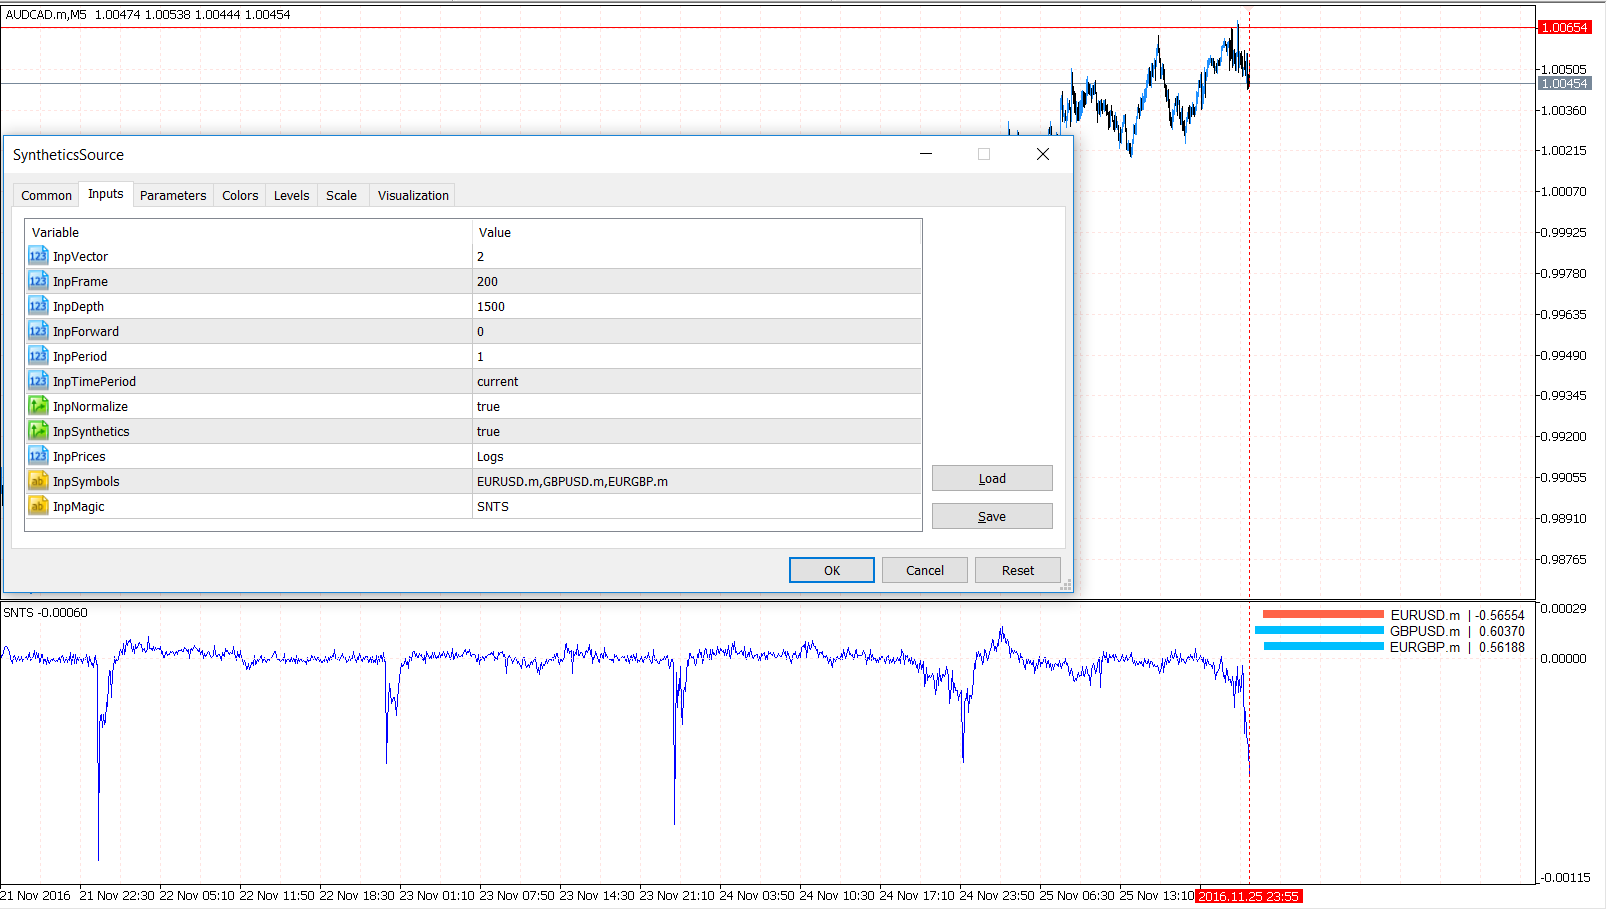
Parameters
InpFrame = 300; // Floating window for calculation of coefficients, for each of InpDepth bars make InpFrame computations
InpDepth = 1000; // The total number of bars in history, for which the chart is drawn
InpForward = 500; // The bar to stop recalculating the coefficients and use the previous ones, this is OOS
InpPeriod = 1; // Smoothing for the МА, to make the chart look less twitched
InpTimePeriod = PERIOD_CURRENT; // Timeframe for the calculations
InpNormalize = true; // Normalize the prices before displaying them, to smooth the volatility gaps of USDJPY and EURGBP
InpSynthetics = true; // Draw the summary synthetic multiplied by the found coefficients or each pair individually
InpPrices = Logs; // Normalization algorithm of pairs
InpSymbols = "AUDUSD,USDCHF,USDCAD"; // Pairs for the portfolio
InpMagic = "ID" // Custom name of the indicator, to facilitate placing multiple instances on one chart without conflicts
The idea was adopted from here: https://www.mql5.com/en/code/9908

Translated from Russian by MetaQuotes Ltd.
Original code: https://www.mql5.com/ru/code/16997
 Relation - Chart Builder Legacy
Indicator for building custom charts, which are based on user-defined formula.
 The MasterMind
The Expert Advisor uses the iStochastic (Stochastic) Oscillator, iWPR (Larry Williams' Percent Range) indicators.
Fractal_Moving_Average
Fractal moving average with indication of the last value with a price label with the ability to change the averaging algorithm.
Fractal_WPR_HTF
The Fractal_WPR indicator with the timeframe selection option available in the input parameters.