Join our fan page
- Views:
- 9326
- Rating:
- Published:
- 2016.11.02 17:51
- Updated:
- 2017.01.16 09:21
-
Need a robot or indicator based on this code? Order it on Freelance Go to Freelance
Definition of 'Dynamic Momentum Index'
An indicator used in technical analysis that determines overbought and oversold conditions of a particular asset. This indicator is very similar to the relative strength index (RSI). The main difference between the two is that the RSI uses a fixed number of time periods (usually 14), while the dynamic momentum index uses different time periods as volatility changes.
Explaination of 'Dynamic Momentum Index'
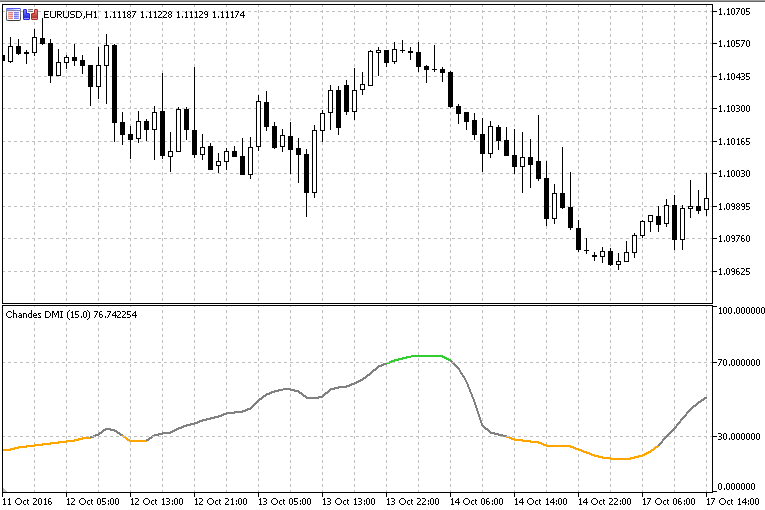
This indicator is interpreted in the same manner as the RSI where readings below 30 are deemed to be oversold and levels over 70 are deemed to be overbought. The number of time periods used in the dynamic momentum index decreases as volatility in the underlying asset increases, making this indicator more responsive to changing prices than the RSI.
This version has an additional smoothing in a form of using RSX for
calculation not the original RSI. It has been added in order to make it a
bit more readable. The original Chande's DMI is less smooth than this
version and can raise more false signals. Using the rsx instead of rsi
does not add any lag at all so we can say that using an rsx instead of
rsi could be clasified as the "1% improvement" rule — what is sure that
it is not worse than the original Chande's DMI.

 Donchian Channel MTF
The multitimeframe version of Donchian channel.
 Stochastic of RSX
Stochastic that is using RSX as an input for calculations.
 RSX Variation
This version of RSX allows you to use instead any momentum length.
 Double Smooothed EMA
The gradient version of double smoothed EMA indicator.