Join our fan page

ClusterBox_DayHistogramm - horizontal cross-section of the market by days - indicator for MetaTrader 4
- Views:
- 14998
- Rating:
- Published:
- 2015.12.11 11:00
- Updated:
- 2016.11.22 07:32
-
 You are missing trading opportunities:
- Free trading apps
- Over 8,000 signals for copying
- Economic news for exploring financial markets
Registration Log inYou agree to website policy and terms of use
If you do not have an account, please register
-
 Need a robot or indicator based on this code? Order it on Freelance
Go to Freelance
Need a robot or indicator based on this code? Order it on Freelance
Go to Freelance
General Information
For each candlestick of any timeframe there is a corresponding amount of ticks that formed it. On Forex charts this trait is displayed as Volume, although it has no direct relation to the real trade volumes. However, the tick volume data can be in the same way as the real volume data.
The information about the ticks that came before the indicator was attached are taken from the special tick file, which is formed with the help of the Ticks collector. A ready-made tick file can also be taken from the archive. If the history rendering is not required, then the indicator values will appear in real-time, provided the new ticks arrive.
About the ClusterBox_DayHistogramm indicator
A variation of the ClusterBox_Histogramm indicator. The difference is the fixed data collection interval. Thus, unlike the ClusterBox_Histogramm indicator, which displayed the tick volumes by clusters for a custom history range set by user, the ClusterBox_DayHistogramm indicator uses 24 hours as the specified interval. This approach allows to see the price concentration levels for each day separately.
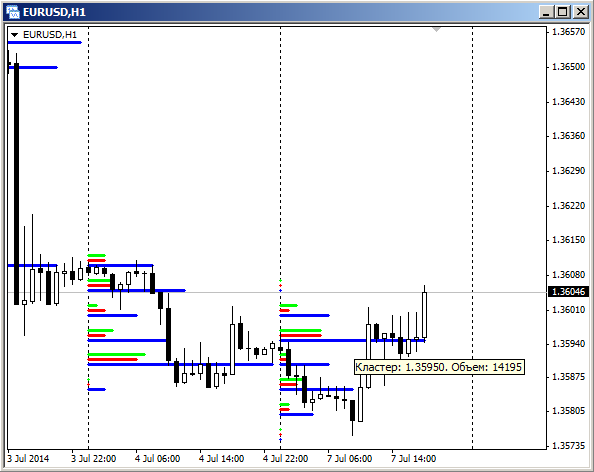
In order to see the precise numerical value of the tick amount corresponding to the cluster, it is necessary to move the mouse cursor to the line of interest. The information about the price cluster and its tick volume will appear in the tooltip.
More detailed usage of the indicator is described in the article The horizontal cross-section of the market.
Translated from Russian by MetaQuotes Ltd.
Original code: https://www.mql5.com/ru/code/14190
ClusterBox_Histogramm - horizontal cross-section of the market
Tick volumes of a specified interval drawn as histogram of clusters.
Arrows Template
An indicator template that draws arrows on the chart.
 Simple News
The Expert Advisor places a grid of pending orders in both directions several minutes before the specified time and trails the Stop Loss order after the orders trigger.
Levels with Trail
The Expert Advisor trades based on the support/resistance levels set by the user, while trailing the Stop Loss order.