Join our fan page
- Views:
- 59796
- Rating:
- Published:
- 2016.02.08 12:02
- Updated:
- 2016.12.28 16:04
-
 You are missing trading opportunities:
- Free trading apps
- Over 8,000 signals for copying
- Economic news for exploring financial markets
Registration Log inYou agree to website policy and terms of use
If you do not have an account, please register
-
 Need a robot or indicator based on this code? Order it on Freelance
Go to Freelance
Need a robot or indicator based on this code? Order it on Freelance
Go to Freelance
Modernization of the popular Equity indicator. The author of the original version: Igor Korepin.
The necessity of the modernization is that the original indicator does not always work correctly with some instruments. For example, some brokers use the tickers with suffixes, prefixes. Also some CFD contracts and futures were considered incorrectly. This version uses a new function of contract value evaluation, which allows to work with any instrument. It retains the original concept and ideology of the indicator.
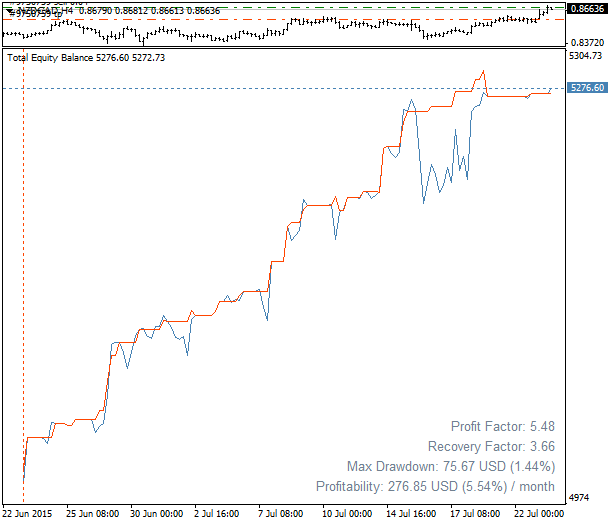
With the default settings the indicator displays two lines: the line of the balance sheet and the line of the equity. Additionally, it is possible to display the level of the used margin (as a histogram) and free equity (additional line) throughout the trading history, which allows to assess the aggressiveness of trade. The trading statistics (can be displayed in any corner of the chart): yields for month, year or the entire period of trading, the maximum drawdown (absolute and percentage), and also the calculation of the profit factor and the recovery factor.
The indicator parameters:- Only_Trade — take into account only the trade operations, excluding the balance ones (replenishment, withdrawal, correction)
- Only_Magics — take into account only the orders with the specified magic numbers (enumeration with any delimiter)
- Only_Symbols — take into account only the orders with the specified ticker (enumeration with any delimiter)
- Only_Comment — take into account only the orders with the specified substring in the comment field
- Only_Current — take into account only the orders on the current symbol of the chart
- Only_Buys — take into account only the buy orders
- Only_Sells — take into account only the sell orders
- Show_Balance — display balance line
- Show_Margin — display used margin histogram
- Show_Free — display free equity line
- Show_Zero — display zero level line
- Show_Info — display statistics (profitability, drawdown, profit factor and recovery factor)
- Alert_Drawdown — signal level of drawdown percentage (0 - disable monitoring)
- Max_Drawdown — maximum allowed drawdown level in percent
- Current_Day — monitoring of drawdown only for the current day
- Begin_Monitoring — drawdown monitoring start time (monitoring period start)
- File_Write — option to write the data to a text file (MQL4\Files folder, file name corresponds to the account number)
- Draw_Begin — chart plotting start time (orders are not considered before this time)
- Report_Period — profitability calculation period: month/year/total
- Text_Corner — corner of the screen to display the statistics
- FX_prefix — prefix for currency pairs (required for some brokers)
- FX_postfix — suffix for currency pairs (required for some brokers)
Operation features:
At the first start of the indicator the chart may be distorted. This means that the history of symbols is not synchronized for that moment. In this case it is necessary to switch the timeframes "back and forth" several times or download the history forcibly for all symbols by opening the corresponding charts. Chart auto-update when switching accounts is implemented in the new version of the indicator.
For the correct operation of the indicator, the trade history in the "History Center" must be fully downloaded.
Translated from Russian by MetaQuotes Ltd.
Original code: https://www.mql5.com/ru/code/13242
 TradeBreakOut
Reveals distance from the actual price up to the breakthrough of recently set support or resistance levels.
 Placing Stop Orders Grid
The script determines the price at the point of the chart, on which it was dropped down, and depending on that it places a grid of orders.
Super Trend
The Super Trend indicator not only determines the trend direction, but also helps to detect the Elliott waves.
Regression Сhannel
The channel indicator plots a linear regression channel.