Join our fan page
- Views:
- 15162
- Rating:
- Published:
- 2016.02.08 11:34
- Updated:
- 2016.11.22 07:32
-
 You are missing trading opportunities:
- Free trading apps
- Over 8,000 signals for copying
- Economic news for exploring financial markets
Registration Log inYou agree to website policy and terms of use
If you do not have an account, please register
-
 Need a robot or indicator based on this code? Order it on Freelance
Go to Freelance
Need a robot or indicator based on this code? Order it on Freelance
Go to Freelance
Real author:
Akif TOKUZ
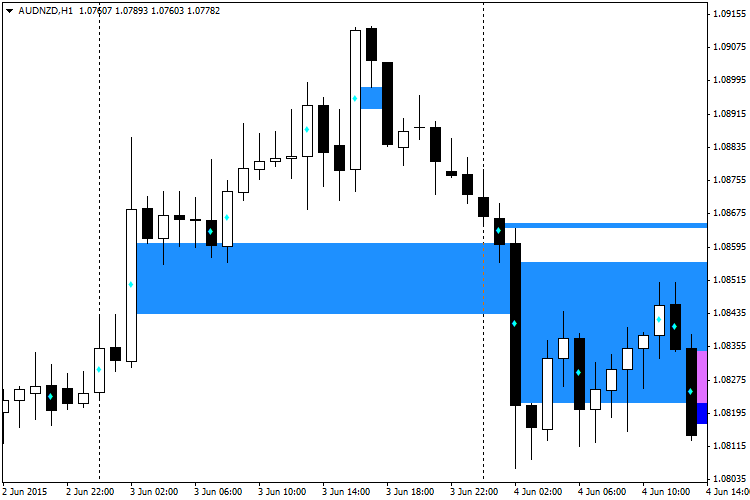
The indicator detects and marks the WRB (Wide Range Bars) or candlesticks with Wide Range Bodies. Because WRBs are not useful themselves, the indicator also determines hidden gaps based on these bars. It shows filled and unfilled hidden gaps differently, so you can quickly get the current situation. You can also turn on notifications about price entering the unfilled gap area.
Input Parameters:
- UseWholeBars (by default = false) — if true, the indicator searches for Wide Range Bars instead of Wide Range Bodies.
- WRB_LookBackBarCount (by default = 3) — how many bars to compare to determine WRB. The higher this price, the rarer and more significant WRBs will be.
- WRB_WingDingsSymbol (by default = 115) — text symbol code to designate WRBs. By default, a small rhombus is used.
- HGcolor1 (by default = clrDodgerBlue) — first (and default) hidden gap rectangles color.
- HGcolor2 (by default = clrBlue) — second color for hidden gap rectangles.
- HGstyle (by default = STYLE_SOLID) — line style for drawing hidden gap rectangles.
- StartCalculationFromBar (by default = 100) — number of bars in chart history to analyze to mark WRBs and hidden gaps.
- HollowBoxes (by default = false) — if true, the hidden gap rectangles will be without filling.
- DoAlerts (by default = false) — true turns on notifications about price entering a hidden gap area.
Translated from Russian by MetaQuotes Ltd.
Original code: https://www.mql5.com/ru/code/13174
 Divergence Petr
The indicator of divergences on 30 oscillators of choice.
 Binario
The Expert Advisor is based on the exponential moving averages of the same period.
Dots
The indicator shows current trend direction by placing colored dots on the main chart.
Easy Trend Visualizer
A simple visualizer of trends.