Join our fan page
- Views:
- 27908
- Rating:
- Published:
- 2010.04.20 10:43
- Updated:
- 2016.11.22 07:32
-
 You are missing trading opportunities:
- Free trading apps
- Over 8,000 signals for copying
- Economic news for exploring financial markets
Registration Log inYou agree to website policy and terms of use
If you do not have an account, please register -
 Need a robot or indicator based on this code? Order it on Freelance
Go to Freelance
Need a robot or indicator based on this code? Order it on Freelance
Go to Freelance
Real author:
This indicator is based on algorithm, proposed by Vladislav Goshkov (VG) 4vg@mail.ru
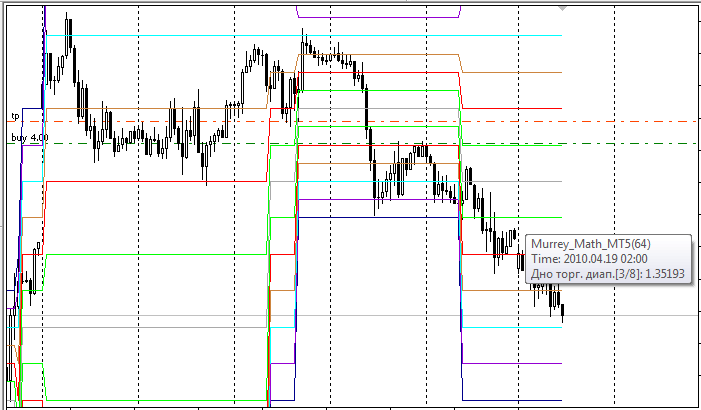
The indicator plots Murrey Math Lines for all available history, it doesn't uses any objects.
Since, according to Gann, prices move in 1/8's, these 1/8's act as points of price support and resistance as an entity's price changes in time. Given this 1/8 characteristic of price action, Murrey assigns properties to each of the MML's in an a given octave. These properties are listed here for convenience.
- 8/8 th's and 0/8 th's Lines (Ultimate Resistance). These lines are the hardest to penetrate on the way up, and give the greatest support on the way down. (Prices may never make it thru these lines).
- 7/8 th's Line (Weak, Stall and Reverse). This line is weak. If prices run up too far too fast, and if they stall at this line they will reverse down fast. If prices do not stall at this line they will move up to the 8/8 th's line.
- 6/8 th's and 2/8 th's Lines (Pivot, Reverse). These two lines are second only to the 4/8 th's line in their ability to force prices to reverse. This is true whether prices are moving up or down.
- 5/8 th's Line (Top of Trading Range). The prices of all entities will spend 40% of the time moving between the 5/8 th's and 3/8 th's lines. If prices move above the 5/8 th's line and stay above it for 10 to 12 days, the entity is said to be selling at a premium to what one wants to pay for it and prices will tend to stay above this line in the "premium area". If, however, prices fall below the 5/8 th's line then they will tend to fall further looking for support at a lower level.
- 4/8 th's Line (Major Support/Resistance). This line provides the greatest amount of support and resistance. This line has the greatest support when prices are above it and the greatest resistance when prices are below it. This price level is the best level to sell and buy against.
- 3/8 th's Line (Bottom of Trading Range). If prices are below this line and moving upwards, this line is difficult to penetrate. If prices penetrate above this line and stay above this line for 10 to 12 days then prices will stay above this line and spend 40% of the time moving between this line and the 5/8 th's line.
- 1/8 th Line (Weak, Stall and Reverse). This line is weak. If prices run down too far too fast, and if they stall at this line they will reverse up fast. If prices do not stall at this line they will move down to the 0/8 th's line.
 \
\
If you have found any errors, please report them at Forum.
Translated from Russian by MetaQuotes Ltd.
Original code: https://www.mql5.com/ru/code/101
 ZeroLag MACD
The ZeroLag MACD indicator shows the histogram with color of the previous bar.
 XmlParser
A simple XML-parser, based on the msxml library.
PivotPointUniversal
The indicator plots Pivot levels for all available history. There are 5 variants of Pivot levels is supported: Classic, Fibonacci, Demark, Camarilla, Woodies. There are 3 calculation periods: daily, weekly, monthly. For the daily pivot levels it's possible to specify the GMT time shift.
 Simple MA Expert Advisor
Something for those who wants to try out new Strategy Tester and don't have any EA.