
Prices rebounded as expected after putting in a Bullish Engulfing candle pattern at support set from October 2013.
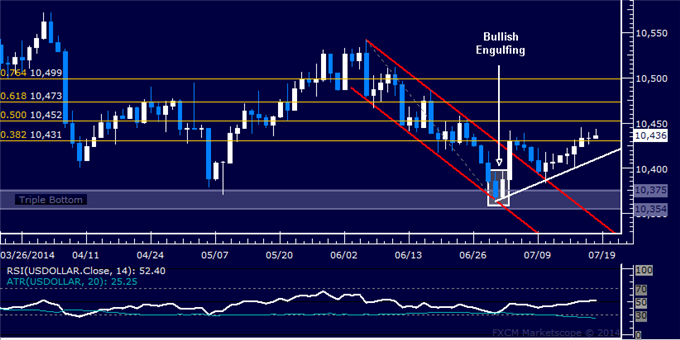
A daily close above the 50% Fibonacci retracement at 10452, initially exposes the 61.8% level at 10743. Alternatively, reversal below the 38.2% Fib at 10431 opens the door for a challenge of rising trend line support at 10409, followed by a triple bottom established from October 2013 in the 10354-75 area.


