
The Algorithm of Ticks' Generation within the Strategy Tester of the MetaTrader 5 Terminal

Creating Expert Advisors - automated trading systems in MQL5
The MetaTrader 5 terminal contains an integrated development environment for the development of fully automated strategies (trading robots), which can perform trading without any human intervention. Another name for these trading robots is Expert Advisors. Expert Advisors and technical indicators for the MetaTrader 5 terminal are written using the MQL5 language, which encompasses all of the advantages of the modern programming languages.
- execution speed;
- support of object oriented programming (OOP);
- ability to debug.
The ability to debug programs in MQL5 allows you to create a code with the maximum security level possible, but though necessary, this is not the only condition required for the development of a profitable trading system. Trading systems, which are able to demonstrate positive results throughout a large interval of historical data, are called robust, which is derived from the English word "robust", meaning tolerant to faults and errors.
Testing trading strategies
Prior to entrusting your capital to an Expert Advisor, you must make sure that its rules for opening and closing positions, as well as rules of money managing, allow for profit expectation. The simplest way to test this is to simulate the work of the Advisor using an available historical data.
The MetaTrader 5 client terminal has a special integrated component, a strategy tester for obtaining results of the Advisor's work with historical data. The process of a onetime run of the Expert Advisor on an interval of dates is called the testing of the Expert Advisor. This onetime test provides us with a large amount of useful information, necessary for drawing conclusions about the robustness of the Expert Advisor.
But to be able to trust these results, the process of testing must model the actual current environment, in which the Expert Advisor is run, as closely as possible. The MetaTrader 5 tester uses a tick by tick modeling of prices, using the historical values of spreads for each instrument, on which a trading operation takes place.
A little history about the strategy tester
MetaTrader 3
- Model of four prices - the price consecutively went through stages of Open, Low, High and Close for the bullish candle, and for the bearish candle it went through Open, High, Low and Close;
- The model "Every 1 point" - uses a wave model 3-5-3, in which the price consecutively goes through a three-wave, then a five-wave, and then another three-wave, with an increment of 1 point;
- Model "Spread / 2" - uses the same model as "Every one point", but the price increment is half of the spread, indicated by the user.
Price modeling has always been based on the bars of the tested time frame, information from lower time frames were not used. The tester from the MetaTrader 3 terminal had many shortcomings, including slow testing speed, low accuracy, and the lack of Expert Advisor optimization by input parameters.
MetaTrader 4
The MetaTrader 4 terminal replaced the third terminal and included a new compiled language MQL4 (Previous MQL-II was interpreted), as well as took an absolutely new approach to testing. Now testing could be carried out in three modes:
- Every tick (Every Tick) - generation of ticks within the candle, allows for a maximum close modeling of Expert Advisor's work to real trading, within the testing environment;
- Checkpoints (Control points) - a compromise between accuracy and speed of testing;
- By opening prices (Open Price) - the launch of the Expert Advisor is made only at the opening of the candle, this allows for a very rapid assessment of the strategy.
An important difference from the tester of the third terminal was that the testing strategy of the MetaTrader 4 terminal used the price data of the youngest available time frame for trading simulation. Therefore, with the presence of the minute history, throughout the tested interval, the test results are maximally close to the results obtained online. In the absence of the underlying time frames, simulation of price development within the bar is generated in the same way as in the tester terminal of MetaTrader 3.
In addition, we gained an opportunity to perform optimization by direct enumeration of input parameters, as well as using a genetic algorithm. This gave us an opportunity to significantly accelerate the process of optimization, especially for strategies with a large number of input parameters. It is now possible to conduct the actual testing in the visual regime. This was a huge step, which was appreciated by traders.
The new MetaTrader terminal of the 5-th generation is based on the experience gained from the design of the previous terminals, and this applies to the strategy tester. Now there is an opportunity to conduct testing of multi-currency strategies, i.e. strategies which are simultaneously traded on multiple instruments.
Strategy optimization can now be conducted not only on all available processor cores, but also on remote agents, located on other computers in the LAN and the global Internet network. This allows you to build up the powers of the tester and perform cloud calculations, which were previously inaccessible, directly in the language of MQL5.
But for a basic understanding of the testing process in the MetaTrader 5 terminal, it is critical to be able to understand how the modeling of prices in a strategy tester takes place.
Algorithm of ticks' generation
Strategy Tester of the MetaTrader 5 terminal uses only one mode of price modeling in testing - the generation of ticks on the basis of existing historical data on minute time frames of the used symbols. The remaining modes of simulations in MetaTrader 4 were removed because despite their high speed, they failed to provide a high accuracy of testing.
Using an M1 time frame in the tester, allows for a very accurate simulation of the price movement, with a minimum number of errors, in contrast to the simulation of ticks based on senior time frames. As a result, the errors in the modeling of prices in the MetaTrader 5 strategy tester are trivial, and the differences between the simulated price and the price that took place in reality, can only be within the scale of a minute bar.
The ability to perform optimization on local and remote agents, in this approach, can compensate for the increase in testing time. The generation of ticks is based on the cached minute entries in an integer format. Therefore, the generation of ticks is made very quickly.
The bars of all the required time frames are formed in the historical data base of the tester in the usual way (just like in the client terminal) with the receiving of the generated ticks. The minute bar tick volume 1 is not subjected to any generation - it can be written with a value of Close.

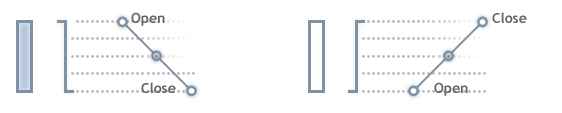
A bar with 2 ticks also isn't generated - first its tick value is recorded as Open, then a tick with a value of Close is recorded.

A bar with 3 ticks is generated according to a scheme, for three-tick bars there are only 4 pattern of bar development:
- Went in one direction and returned to the level of Open
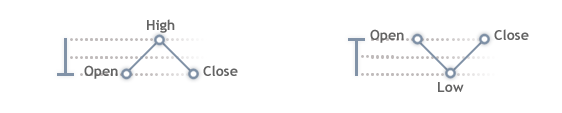
- Went to one side, fell back, and reached a level Open

- Went in one direction, fell back, but did not reached the level of Open
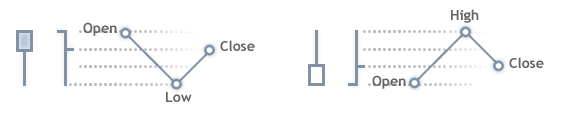
- Several points in one direction
Support point
If the bar has more than 3 ticks, then first the support points are generated. The number of support points cannot be greater than the volume of the tick. The opening price is not included in counting the number of support points, since it is the starting point. Maximum number of support points - 11.
Supporting points are distributed between the opening shadow, the scale of the candle, and the closing candle shadow.
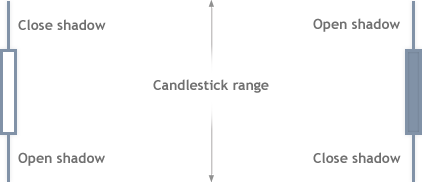
Depending on the number of ticks the distribution of support points is as follows (opening shadow - the scope of the candle - closing the shadow):
3 - 5 - 3If the candle does not have one of the shadows, then the support points of these shadows are given to the magnitude of the candles.
2 - 6 - 2
2 - 5 - 2
2 - 4 - 2
2 - 3 - 2
1 - 4 - 1
1 - 3 - 1
1 - 2 - 1
1 - 1 - 1
The scope of the candle is generated by an odd number of support points. If the scope has an even number of support points, then the "extra" point is given to one of the shadows under the condition that the shadow already has 2 points. Otherwise, the "extra" point simply disappears.
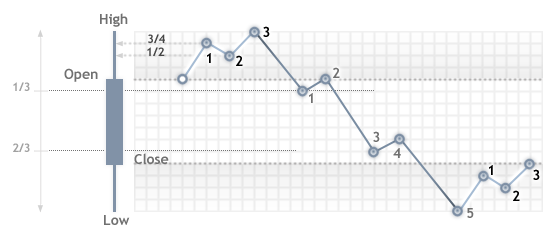
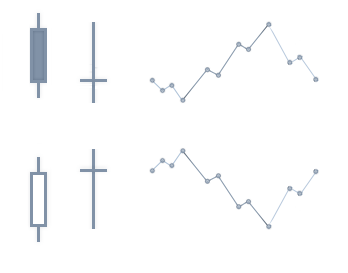
For a bear (black) candle generation of support points on the 3-5-3 pattern is similar:
If the candle is a doji, that is Close == Open, then the previous candles are analyzed, if the previous candle was rising, then this doji is considered to be a candle downward candle.
If the shadow is generated using three support points and integer values 3 / 4 the size of the shadow and 1 / 2 the size of the shadow are equal (this happens when the difference between Open and Low or Open and High is not greater than 2 points), then the generation of the shadow changes in the following way:
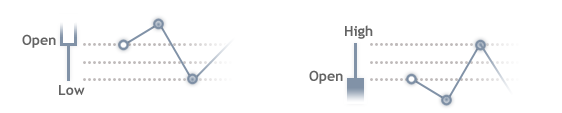
If the shadow is generated by two support points, then the control points are arranged in the following way:

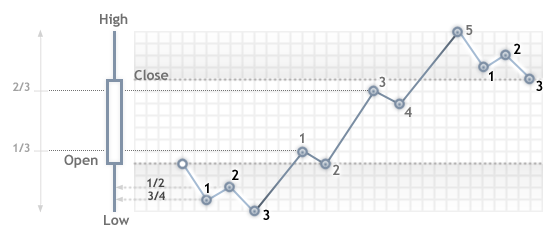
Formation of a ground of support points from Low to High
The scope of the candle is generated by impulse waves, the number of waves is calculated as:
number of waves = (number of support points in the scope + 1) / 2.
For example, if the number of support points in the scope of the candle is equal to 5 (Figure 3-5-3), then 3 waves will be generated = (5 +1) / 2.
Each impulse wave has a length step in points, which is calculated by the formula:
step=(High-Low-1)/(quantity of waves)+1
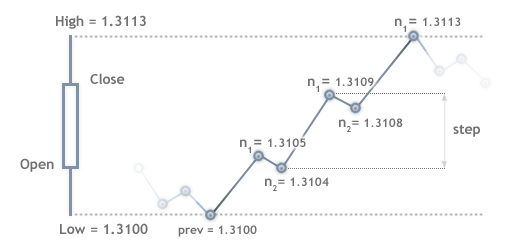
For example, the scope of the candles (High - Low) = (1.3113 - 1.3100) = 0.0013 is 13 points, while the wavelength step = (13-1) / 3 +1 = 5 points.
After the impulse step points should be rolled back by 1 point. Further in the cycle the positions of support points are calculated (for a bull candle):
prev=low
cycle
  n1=prev+step
  n2=prev+step-1
  prev=n2
where:
- n1 - first impulse point of support
- n2 - second support point - the point of rollback.
Let's apply this algorithm to a bull candles in a 3-5-3 scheme, where the number of waves equals to 3 and the step = 5 points, point = 0.0001:
- First step. Variable prev = Low = 1.3100, enter the cycle.
- Calculate the data for the first wave
- We calculate the position of point n1 = prev + step = 1.3100 + 5 * 0.0001 = 1.3105.
- We calculate the position of point n2 = prev + step-1 = 1.3100 + 5 * 0.0001-1 * 0.0001 = 1.3104;
- Assign the value n2: prev = 1.3104 to the prev variable;
- Calculate the data for the second wave
- Calculate the position of point n1 = prev + step = 1.3104 + 5 * 0.0001 = 1.3109.
- We calculate the position of point n2 = prev + step-1 + 5 = 1.3104 * 0.0001-1 * 0.0001 = 1.3108;
- Assign the value of n2: prev=1.3108 to the prev variable;
- Calculate the data for the third wave
- We calculate the position of point n1 = prev + step = 1.3108 + 5 * 0.0001 = 1.3113.
- Exit the cycle, prev = n2 = 1.3112
All of the above is demonstrated for clarity on the picture:
Calculating the support points for bear candles is done in the same manner:
prev=high
cycle
  n1=prev-step
  n2=prev-step+1
  prev=n2
The generation of ticks is carried out based on support points
Intermediate ticks between support points are generated according to the following rules:- If the number of ticks is larger than the number of points between the support points, then a "saw" is generated.
- If there are a number of points between the support points, then a linear sequence of ticks is generated.
Check tick sequence
In conclusion, let us compare the tick history, recorded from the MetaQuotes-Demo server on May 13, 2010 from 13:00 to 13:30, with the tick sequence generated by the tester in the MetaTrader 5 client terminal. An Expert Advisor was used to record ticks into the agent log:
//+------------------------------------------------------------------+
//|                                                  Write_Ticks.mq5 |
//|              Copyright Copyright 2010, MetaQuotes Software Corp. |
//|                                              https://www.mql5.com |
//+------------------------------------------------------------------+

input datetime start=D'2010.05.13 13:00:00';
input datetime end=D'2010.05.13 14:00:00';

//+------------------------------------------------------------------+
//| Expert tick function                                             |
//+------------------------------------------------------------------+
void OnTick()
  {
   MqlTick tick;
   datetime time=TimeCurrent();
//---
   SymbolInfoTick(Symbol(),tick);
   Print(time,tick.bid);
//---
   if(time>end) ExpertRemove();
//---
  }
The history of ticks was collected online, using the indicator described in the article Creating tick indicators.
Both of the tick sequences - the one from the tester and the one stored in a file - are represented on the chart. Ticks obtained during testing are represented by a green color, and ticks obtained on the trading server MetaQuotes-Demo, and recorded in the file indicator, are represented by a blue color.
You can point the mouse to any point on the graph and read information on each tick in the pop-up windows:
- origin (Tester or History);
- time of the tick;
- price of the tick.
The graph clearly shows that the quality of simulation ticks in the tester MetaTrader 5 client terminal allows for adequate testing of Expert Advisors on historical data.
Translated from Russian by MetaQuotes Ltd.
Original article: https://www.mql5.com/ru/articles/75
 New Opportunities with MetaTrader 5
 OOP in MQL5 by Example: Processing Warning and Error Codes
 The Magic of Filtration
 MQL for "Dummies": How to Design and Construct Object Classes
- Free trading apps
- Over 8,000 signals for copying
- Economic news for exploring financial markets
You agree to website policy and terms of use
Hi, I've executed several tests using Strategy Tester and I found a problem with ticks generated automatically by Strategy Tester, it's impossible to reply true tick movements (please see attached document) and this situation obsviously impact in your test results, so I'm currently using my own tick history data (from TrueFx.com) in Meta Trader according the following guidelines https://eareview.net/tick-data/convert-tick-data .
I think this article is helpful to you. https://www.mql5.com/en/articles/75
Btw, the algorithm of ticks ' generation in MT4 is really confused especially the modes of control points.
Im wondering if anyone had further thoughts on UGO58’s question of a few years ago?
I have an ea with good results on all tick mode but fails demo.
Is it possible to apply the tick generator algo real time or does tester collect whole 1 minute bar history before applying the algo.
Im wondering if anyone had further thoughts on UGO58’s question of a few years ago?
I have an ea with good results on all tick mode but fails demo.
Is it possible to apply the tick generator algo real time or does tester collect whole 1 minute bar history before applying the algo.
Funny. It's like "I had a dream is it possible to apply it in reality ?"...lol