
Creating Tick Indicators in MQL5

Introduction
In trading, it would be desirable to have an information as much as possible, to see the detailed picture of the price changes. You can use the tick chart. Let's try to create a tick chart in MQL5.
This article describes the creation of two indicators: a tick price chart and "Tick Candles" chart, that draws the candles that contains a specified number of ticks. Each of the indicators considered write the received price values to the file for the construction of the indicator's data after restart of the client terminal (this data also can be used by the other programs).
Creating Tick Indicator
Let's write an indicator in MQL5, that draws tick data on the chart. An example of such an indicator is presented at Fig. 1:
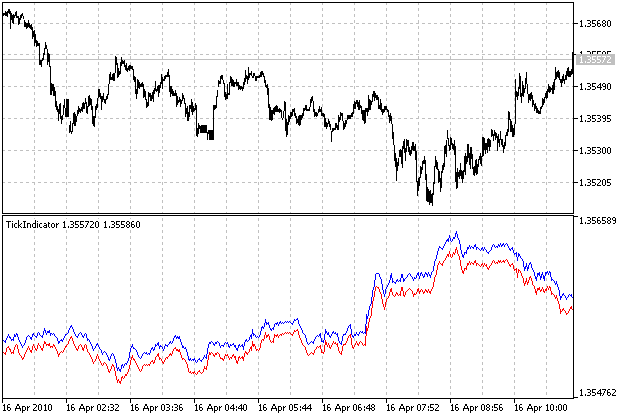
Figure 1. Example of a tick chart
The indicator plots two lines: Bid and Ask prices. The drawing of each of them can be turned off in the options of the indicator.
The indicator saves the prices of the current symbol, received from the broker in a text file with the following format: Server time, Bid price and Ask price:
2010.03.26 19:43:02 1.33955 1.33968
The file name corresponds to the name of financial instrument (for example, EURUSD.txt). The files are located in the following path: MT5_Folder\MQL5\Files. The additional directory for a file and file name prefix can be specified in the indicator's options (it can be useful if there are several indicators, attached to the charts with the same symbol).
To create an indicator, launch MetaTrader 5 client terminal and launch MetaQuotes Language Editor by pressing the F4 key. Let's begin to write the code of a program.
We will specify that indicator should be plotted in a separate window below the price chart:
// indicator in a separate window
#property indicator_separate_window
The two indicator lines (Bid and Ask prices respectively) should be drawn, so we have to use two graphic plots:
// two graphic plots are used: for Bid and Ask lines
#property indicator_plots 2
We have to specify two indicator's buffers, containing the data to be plotted on the chart:
// two indicator's buffers
#property indicator_buffers 2
For each of the indicator's lines, let's define drawing type DRAW_LINE (line), drawing style STYLE_SOLID (solid line) and text labels "Bid" and "Ask":
// drawing type of a Bid line
#property indicator_type1 DRAW_LINE
// drawing color of a Bid line
#property indicator_color1 Red
// drawing style of a Bid line
#property indicator_style1 STYLE_SOLID
// text label of a Bid line
#property indicator_label1 "Bid"
// drawing type of an Ask line
#property indicator_type2 DRAW_LINE
// drawing color of an Ask line
#property indicator_color2 Blue
// drawing style of an Ask line
#property indicator_style2 STYLE_SOLID
// text label of an Ask line
#property indicator_label2 "Ask"
Let's specify the input variables, whose values can be changed by the user in the options menu of the indicator.
// the BidLineEnable indicates showing of a Bid line
input bool BidLineEnable=true; // Show Bid Line
// the AskLineEnable indicates showing of an Ask line
input bool AskLineEnable=true; // Show Ask Line
// the path_prefix defines a path and file name prefix
input string path_prefix=""; // FileName Prefix
The BidLineEnable and AskLineEnable variables allow you to enable and disable showing of Bid and Ask lines in the indicator. The path_prefix variable allows you to specify the file name prefix, located before the name of file. Using this variable, you can also specify the path to a subdirectory, for example, if path_prefix = "MyBroker/test_", the path for the files will be as follows: "MetaTrader5_Folder\MQL5\Files\MyBroker", for the symbol "EURUSD" the file name will be "test_EURUSD.txt".
At global level, let's declare the variables, that will be used in various functions of the indicator, the values of these variables is saved between the calls of the indicator:
// the tick_stored variable is a number of served quotes
int ticks_stored;
// the BidBuffer[] and AskBuffer[] arrays - are indicator's buffers
double BidBuffer[],AskBuffer[];
The tick_stored variable will be used to store the number of quotes available. The BidBuffer[] and AskBuffer[] are dynamic arrays, used as an indicator buffers, the price data, plotted on the chart as Bid and ask lines, are stored in these buffers.
The OnInit function indicates that the BidBuffer[] and AskBuffer[] arrays contain the data for the plotting. Let's specify that the data with values of the indicator buffer, equal to zero, should not be plotted on the chart.
void OnInit()
  {
   // the BidBuffer[] is an indicator buffer
   SetIndexBuffer(0,BidBuffer,INDICATOR_DATA);
   // the AskBuffer[] is an indicator buffer
   SetIndexBuffer(1,AskBuffer,INDICATOR_DATA);
   // setting EMPTY_VALUE for a Bid line
   PlotIndexSetDouble(0,PLOT_EMPTY_VALUE,0);
   // setting EMPTY_VALUE for an Ask line
   PlotIndexSetDouble(1,PLOT_EMPTY_VALUE,0);
  }
Now we create the OnCalculate function, and list all the parameters passed to the function when it called:
int OnCalculate(const int rates_total,
                const int prev_calculated,
                const datetime &time[],
                const double &open[],
                const double &high[],
                const double &low[],
                const double &close[],
                const long &tick_volume[],
                const long &volume[],
                const int &spread[])
Let's declare the variables:
// the file_handle variable is a file handle
// the BidPosition and AskPosition - are positions of Bid and Ask prices in the string;
// the line_string_len is a length of a string, read from the file, i is a loop counter;
int file_handle,BidPosition,AskPosition,line_string_len,i;
// the last_price_bid is the last Bid quote
double last_price_bid=SymbolInfoDouble(Symbol(),SYMBOL_BID);
// the last_price_ask is the last Ask quote
double last_price_ask=SymbolInfoDouble(Symbol(),SYMBOL_ASK);
// the filename is a name of a file, the file_buffer is a string,
// used as a buffer for reading and writing of string data
string filename,file_buffer;
The file_handle variable of an integer type will be used to store the handle of the file in the file operations, the BidPosition and AskPosition - will be used for a storage of Bid and Ask prices starting positions in the string, the line_string_len - will be used for the string length, read from the file, the i variable will be used as a loop counter. The values of last received Bid and Ask prices are stored in the last_price_bid and last_price_ask variables. The filename string variable is used to store the file name, the file_buffer is a string used for a reading and writing to the file.
The file name is constructed from the path_prefix variable, name of financial instrument and ".txt" file extension. The use of the StringConcatenate function is more preferable than the concatenation of a strings by using the addition operator, because it works faster and more economical on memory.
// File name formation from the path_prefix variable, name
// of financial instrument and ".Txt" symbols
StringConcatenate(filename,path_prefix,Symbol(),".txt");
We open the file using the FileOpen function for its futher use:
// Opening a file for reading and writing, codepage ANSI, shared reading mode
file_handle=FileOpen(filename,FILE_READ|FILE_WRITE|FILE_ANSI|FILE_SHARE_READ);
We use the FILE_READ and FILE_WRITE flags, because we will read and write the data to the file, the FILE_ANSI flag indicates that ANSI codepage will be used (default is Unicode), the FILE_SHARE_READ flag means that shared access is allowed for reading by the other applications while working with it.
At first launch of the indicator there isn't any data (or chart period has been changed):
 // At first execution of OnCalculate function, we are reading the quotes from a file
 if(prev_calculated==0)
  {
   // Reading the first line from the file and determine the length of a string
   line_string_len=StringLen(FileReadString(file_handle))+2;
   // if file is large (contains more quotes than rates_total/2)
   if(FileSize(file_handle)>(ulong)line_string_len*rates_total/2)
     {
      // Setting file pointer to read the latest rates_total/2 quotes
      FileSeek(file_handle,-line_string_len*rates_total/2,SEEK_END);
      // Moving file pointer to the beginning of the next line
      FileReadString(file_handle);
     }
   // if file size is small
   else
     {
      // Moving file pointer at the beginning of a file
      FileSeek(file_handle,0,SEEK_SET);
     }
   // Reset the counter of stored quotes
   ticks_stored=0;
   // Reading until the end of the file
   while(FileIsEnding(file_handle)==false)
    {
      // Reading a string from the file
      file_buffer=FileReadString(file_handle);
      // Processing of string if its length is larger than 6 characters
      if(StringLen(file_buffer)>6)
        {
         // Finding the start position of Bid price in the line
         BidPosition=StringFind(file_buffer," ",StringFind(file_buffer," ")+1)+1;
         // Finding the start position of Ask price in the line
         AskPosition=StringFind(file_buffer," ",BidPosition)+1;
         // If the Bid line should be plotted, adding this value to BidBuffer[] array
         if(BidLineEnable)
         BidBuffer[ticks_stored]=StringToDouble(StringSubstr(file_buffer,BidPosition,AskPosition-BidPosition-1));
         // If the Ask line should be plotted, adding this value to AskBuffer[] array
         if(AskLineEnable)
         AskBuffer[ticks_stored]=StringToDouble(StringSubstr(file_buffer,AskPosition));
         // Increasing the counter of stored quotes
         ticks_stored++;
        }
     }
  }
We will limit the number of quotes, that should be read from the file by the half of a number of bars on the chart. The first, we read the string from the file and determine its length. At the end of a line there are two additional characters with codes 10 and 13 ("newline" and "carriage return"), so we have to increase the line length by 2.
We assume that average length of the remaining lines of the file is the same. If file length is greater than product of the length of one line on the number of rates_total/2 (ie, if the file contains more quotes than rates_total/2), we will read only rates_total/2 last quotes. Do do it, we set the file pointer at the distance, equal to the product of a string length by rates_total/2 (from the end of the file) and read one line from the file to allign file pointer to the beginning of a line.
Note that we compare two values using the if operator, they have different types: the file length is ulong type, the expression on the right side has int type. Therefore we perform the explicit typecasting of the right side expression to ulong type.
If the file contains less quotes, than rates_total/2, then we move file pointer to the beginning of the file.
We set the quotes counter to zero and read the lines from a file, until reaching the end of a file. The strings processing is performed for the strings with the length is greater than six characherts - it's a minimal string length, that contains one character for the date, time, bid and ask and separators between them. We extract the Bid and Ask values from a string, read from the file if the corresponding line should be plotted, and increase the quotes counter.
If the data have been read before, we move file pointer at end of the file by using the FileSeek function (the new data is written to the file). Using the StringConcatenate function, we generate the string, that will be written into a file using the FileWrite function. We add the new values of Bid and Ask prices to the BidBuffer[] and AskBuffer[], arrays, if the corresponding line should be plotted and increase the quotes counter.
  // If the data have been read before
else
  {
   // Moving file pointer at the end of the file
   FileSeek(file_handle,0,SEEK_END);
   // Forming a string, that should be written to the file
   StringConcatenate(file_buffer,TimeCurrent()," ",DoubleToString(last_price_bid,_Digits)," ",DoubleToString(last_price_ask,_Digits));
   // Writing a string to the file
   FileWrite(file_handle,file_buffer);
   // If the Bid line should be plotted, adding the last Bid price to the BidBuffer[] array
   if(BidLineEnable) BidBuffer[ticks_stored]=last_price_bid;
   // If the Ask line should be plotted, adding the last Ask price to the AskBuffer[] array
   if(AskLineEnable) AskBuffer[ticks_stored]=last_price_ask;
   // Increasing the quotes counter
   ticks_stored++;
  }
One might ask, why you dont't read data from a file inside the OnInit function? The reason is the following: the length of the BidBuffer[] and AskBuffer[] dynamic arrays hasn't been defined, it specified when the OnCalculate function is called.
We close the file previously opened:
// Closing the file
FileClose(file_handle);
For the case if quotes counter will be equal or greater than number of bars on the chart after the reading from file or after the adding to BidBuffer[] and AskBuffer[] arrays, the half of the old quotes will be removed and and the remaining will be moved at their place.
// If number of quotes is more or equal than number of bars in the chart
if(ticks_stored>=rates_total)
  {
   // Removing the first tick_stored/2 quotes and shifting remaining quotes
   for(i=ticks_stored/2;i<ticks_stored;i++)
     {
      // If the Bid line should be plotted, shifting the values of BidBuffer[] array on tick_stored/2
      if(BidLineEnable) BidBuffer[i-ticks_stored/2]=BidBuffer[i];
      // If the Ask line should be plotted, shifting the values of AskBuffer[] array on tick_stored/2
      if(AskLineEnable) AskBuffer[i-ticks_stored/2]=AskBuffer[i];
     }
   // Changing the value of a counter
   ticks_stored-=ticks_stored/2;
  }
The BidBuffer[] and AskBuffer[] arrays of the indicator buffers aren't timeseries, so the recent element has index equal ticks_stored-1, the recent chart ba has index equal to rates_total-1. To combine them to the same level, let's shift the line of the indicator using the PlotIndexSetInteger function:
// Shifting the Bid line to align with the price chart
PlotIndexSetInteger(0,PLOT_SHIFT,rates_total-ticks_stored);
// Shifting the Ask line to align with the price chart
PlotIndexSetInteger(1,PLOT_SHIFT,rates_total-ticks_stored);
The values of the recent received prices are stored to BidBuffer[] and AskBuffer[] with the index equal to rates_total-1 (if the corresponding lines should be plotted) to show them at the upper left corner of the indicator's window.
// If the Bid line should be plotted, placing the value to the last element
// of BidBuffer [] array to show the last Bid price in the indicator's window
if(BidLineEnable) BidBuffer[rates_total-1]=last_price_bid;
// If the Ask line should be plotted, placing the value to the last element
// of AskBuffer [] array to show the last Ask price in the indicator's window
if(AskLineEnable) AskBuffer[rates_total-1]=last_price_ask;
The execution of OnCalculate function is completed by return of rates_total (you can return any number, different from zero), the code of the function ends with a curly bracket.
// Return from OnCalculate(), return a value, different from zero
return(rates_total);
}
The Tick indicator has been written. The full source code of the indicator can be downloaded at link, located at the end of the article.
Creating the "Tick Candles" Indicator
Now let's write an indicator, that plots so-called "tick candles". Unlike the conventional candle chart, where each candle corresponds to the specified time period, the "Tick Candles" chart has the different structure: the each candle has some predefined number of ticks, received from the broker (equivolume candles). This indicator looks as shown at the Figure 2:
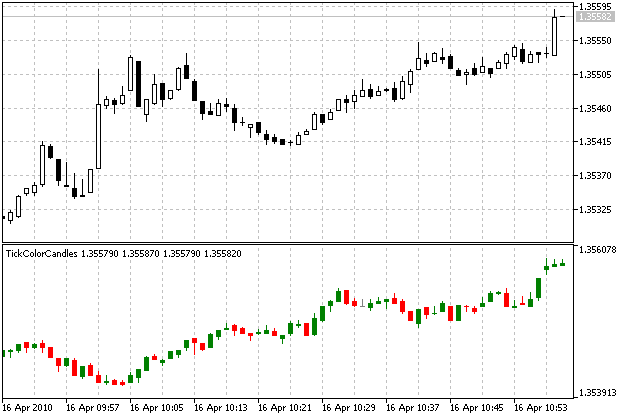
Figure 2. The "Tick Candles" indicator
The "Tick Candles" indicator, as well as the tick indicator, considered above, writes all incoming quotes to the file. The data format and file location details are the same. The file path, name prefix, number of ticks for a candle and type of a price (Bid or Ask) can be specified in the options of the indicator.
To create an indicator, launch MetaTrader 5 client terminal and launch MetaQuotes Language Editor by pressing the F4 key.
Let's specify, that it should be plotted in a separate window:
// Indicator is plotted in a separate window
#property indicator_separate_window
The indicator has an only one graphical plot: color candles.
// One graphic plot is used, color candles
#property indicator_plots 1
We need four buffers for showing of the colored candles and for storing of the price data values (open, high, low and close) values of the price for each candle. Also we need one additional buffer to store color indexes of the candles.
// We need 4 buffers for OHLC prices and one - for the index of color
#property indicator_buffers 5
Let's specify drawing type: DRAW_COLOR_CANDLES - color candles.
// Specifying the drawing type - color candles
#property indicator_type1 DRAW_COLOR_CANDLES
Let's specifying the colors, that will be used for the candles:
// Specifying the colors for the candles
#property indicator_color1 Gray,Red,Green
Let's create the price_types of enumeration type, containing one of the following values: Bid or Ask:
/ / Declaration of the enumeration
enum price_types
  (
   Bid,
   Ask
  )
We specify the input parameters, that can be changed by user from the options menu of the indicator:
// The ticks_in_candle input variable specifies the number of ticks,
// corresponding to one candle
input int ticks_in_candle=16; //Tick Count in Candles
// The applied_price input variable of price_types type indicates
// the type of the data, that is used in the indicator: Bid or Ask prices.
input price_types applied_price=0; // Price
// The path_prefix input variable specifies the path and prefix to the file name
input string path_prefix=""; // FileName Prefix
The ticks_in_candle variable specifies the number of ticks correspond to one candle. The applied_price variable indicates the type of a price, used for the candles construction: Bid or Ask. The directory and file name prefix of file for historical ticks data can be specified in the path_prefix variable.
The variables with values, that should be saved between the calls of the indicator, are declared at global level.
// The ticks_stored variable contains the number of stored quotes
int ticks_stored;
// The TicksBuffer [] array is used to store the incoming prices
// The OpenBuffer [], HighBuffer [], LowBuffer [] and CloseBuffer [] arrays
// are used to store the OHLC prices of the candles
// The ColorIndexBuffer [] array is used to store the index of color candles
double TicksBuffer[],OpenBuffer[],HighBuffer[],LowBuffer[],CloseBuffer[],ColorIndexBuffer[];
The ticks_stored variable is used to store the number of available quotes. The TicksBuffer[] array is used for a storage of the received quotes, the OpenBuffer[], HighBuffer[], LowBuffer[] and CloseBuffer[] arrays are used for a storage of candle prices (opening, highest, lowest and closing), which will be plotted on the chart. The ColorIndexBuffer[] array is used for a storage of color index of the candles.
The OnInit function indicates that the OpenBuffer[], HighBuffer[], LowBuffer[] and CloseBuffer[] arrays are used as an indicator's buffers, the ColorIndexBuffer[] array contains a color index of candles, the TicksBuffer[] array is used for the intermediate calculations:
void OnInit()
  {
   // The OpenBuffer[] array is an indicator buffer
   SetIndexBuffer(0,OpenBuffer,INDICATOR_DATA);
   // The HighBuffer[] array is an indicator buffer
   SetIndexBuffer(1,HighBuffer,INDICATOR_DATA);
   // The LowBuffer[] array is an indicator buffer
   SetIndexBuffer(2,LowBuffer,INDICATOR_DATA);
   // The CloseBuffer[] array is an indicator buffer
   SetIndexBuffer(3,CloseBuffer,INDICATOR_DATA);
   // The ColorIndexBuffer[] array is the buffer of the color index
   SetIndexBuffer(4,ColorIndexBuffer,INDICATOR_COLOR_INDEX);
   // The TicksBuffer[] array is used for intermediate calculations
   SetIndexBuffer(5,TicksBuffer,INDICATOR_CALCULATIONS);
The next we specify the OpenBuffer[], HighBuffer[], LowBuffer[], CloseBuffer[] and ColorIndexBuffer[] arrays as timeseries (i.e. the most recent data has index 0):
   // The indexation of OpenBuffer[] array as timeseries
   ArraySetAsSeries(OpenBuffer,true);
   // The indexation of HighBuffer[] array as timeseries
   ArraySetAsSeries(HighBuffer,true);
   // The indexation of LowBuffer[] array as timeseries
   ArraySetAsSeries(LowBuffer,true);
   // The indexation of CloseBuffer[] array as timeseries
   ArraySetAsSeries(CloseBuffer,true);
   // The indexation of the ColorIndexBuffer [] array as timeseries
   ArraySetAsSeries(ColorIndexBuffer,true);
The values of the indicator buffers equal to 0, should not be plotted on the chart:
   // The null values of Open prices (0th graphic plot) should not be plotted
   PlotIndexSetDouble(0,PLOT_EMPTY_VALUE,0);
   // The null values of High prices (1st graphic plot) should not be plotted
   PlotIndexSetDouble(1,PLOT_EMPTY_VALUE,0);
   // The null values of Low prices (2nd graphic plot) should not be plotted
   PlotIndexSetDouble(2,PLOT_EMPTY_VALUE,0);
   // The null values of Close prices (3rd graphic plot) should not be plotted
   PlotIndexSetDouble(3,PLOT_EMPTY_VALUE,0);
The writing of the OnInit function is completed, we close the function using a curly bracket.
It's time to write the OnCalculate function. Let's specify all parameters, passed to the function:
int OnCalculate(const int rates_total,
                const int prev_calculated,
                const datetime &time[],
                const double &open[],
                const double &high[],
                const double &low[],
                const double &close[],
                const long &tick_volume[],
                const long &volume[],
                const int &spread[])
  {
We declare the variables, that will be used in the OnInit function.
// the file_handle variable is a file handle
// the BidPosition and AskPosition - are positions of Bid and Ask prices in the string;
// the line_string_len is a length of a string, read from the file,
// CandleNumber - number of candle, for which the prices OHLC are determined,
// i - loop counter;
int file_handle,BidPosition,AskPosition,line_string_len,CandleNumber,i;
// The last_price_bid variable is the recent received Bid price
double last_price_bid=SymbolInfoDouble(Symbol(),SYMBOL_BID);
// The last_price_ask variable is the recent received Ask price
double last_price_ask=SymbolInfoDouble(Symbol(),SYMBOL_ASK);
// the filename is a name of a file, the file_buffer is a string,
// used as a buffer for reading and writing of string data
string filename,file_buffer;
The file_handle variable of integer type is used to store the handle of file in the file operations, the BidPosition and AskPosition are used for a storage of Bid and Ask prices starting positions in the string, the line_string_len is a string length, read from a file, the CandleNumber - is the index of the calculated candle, the i variable is used as a loop counter.
The recent received Bid and Ask prices are stored in the last_price_bid and last_price_ask variables of double type. The filename variable of a string type is used for a file name storage, the file_buffer is a string, used in file operations.
The size of TicksBuffer[] array isn't set automatically, unlike the OpenBuffer[], HighBuffer[], LowBuffer[], CloseBuffer[] and ColorIndexBuffer[] arrays, which are indicator's buffers, so let's set the size of an array TicksBuffer[] as the same as the size of OpenBuffer[], HighBuffer[], LowBuffer[], CloseBuffer[] and ColorIndexBuffer[] arrays:
// Setting the size of TicksBuffer[] array
ArrayResize(TicksBuffer,ArraySize(CloseBuffer));
Prepare the file name from the path_prefix variable, name of financial instrument and ".txt" extension:
// File name formation from the path_prefix variable, name
// of financial instrument and ".Txt" symbols
StringConcatenate(filename,path_prefix,Symbol(),".txt");
Let's open the file with parameters, described above for the previous indicator.
// Opening a file for reading and writing, codepage ANSI, shared reading mode
file_handle=FileOpen(filename,FILE_READ|FILE_WRITE|FILE_ANSI|FILE_SHARE_READ);
If the OnCalculate function is called the first time and there isn't any data in the TicksBuffer[] array, we read them from file:
if(prev_calculated==0)
  {
   // Reading the first line from the file and determine the length of a string
   line_string_len=StringLen(FileReadString(file_handle))+2;
   // if file is large (contains more quotes than rates_total/2)
   if(FileSize(file_handle)>(ulong)line_string_len*rates_total/2)
     {
      // Setting file pointer to read the latest rates_total/2 quotes
      FileSeek(file_handle,-line_string_len*rates_total/2,SEEK_END);
      // Moving file pointer to the beginning of the next line
      FileReadString(file_handle);
     }
   // if file size is small
   else
     {
      // Moving file pointer at the beginning of a file
      FileSeek(file_handle,0,SEEK_SET);
     }
   // Reset the counter of stored quotes
   ticks_stored=0;
   // Reading until the end of the file
   while(FileIsEnding(file_handle)==false)
     {
      // Reading a string from thefile
      file_buffer=FileReadString(file_handle);
      // Processing of string if its length is larger than 6 characters
      if(StringLen(file_buffer)>6)
        {
         // Finding the start position of Bid price in the line
         BidPosition=StringFind(file_buffer," ",StringFind(file_buffer," ")+1)+1;
          //Finding the start position of Ask price in the line
         AskPosition=StringFind(file_buffer," ",BidPosition)+1;
         // If the Bid prices are used, adding the Bid price to TicksBuffer[] array
         if(applied_price==0)
         TicksBuffer[ticks_stored]=StringToDouble(StringSubstr(file_buffer,BidPosition,AskPosition-BidPosition-1));
         // If the Ask prices are used, adding the Ask price to TicksBuffer[] array
         if(applied_price==1)
         TicksBuffer[ticks_stored]=StringToDouble(StringSubstr(file_buffer,AskPosition));
         // Increasing the counter of stored quotes
         ticks_stored++;
        }
     }
  }
The reading of quotes from the the file has been described above in more detail, it's same as for the previous indicator.
If the quotes has been read before into the TicksBuffer[] array, we write a new price values to the file, place a new price to TicksBuffer[] array and increase the quotes counter:
// If the data have been read before
else
  {
   // Moving file pointer at the end of the file
   FileSeek(file_handle,0,SEEK_END);
   // Forming a string, that should be written to the file
   StringConcatenate(file_buffer,TimeCurrent()," ",DoubleToString(last_price_bid,_Digits)," ",DoubleToString(last_price_ask,_Digits));
   // Writing a string to the file
   FileWrite(file_handle,file_buffer);
   // If the Bid prices are used, adding the last Bid price to TicksBuffer[] array
   if(applied_price==0) TicksBuffer[ticks_stored]=last_price_bid;
   // If the Ask prices are used, adding the last Ask price to TicksBuffer[] array
   if(applied_price==1) TicksBuffer[ticks_stored]=last_price_ask;
   // Increasing the quotes counter
   ticks_stored++;
  }
Close of the file:
// Closing the file
FileClose(file_handle);
If number of stored quotes reached the number of bars on the price chart or become more, we remove the half of the oldest data and shifting the remaining data:
// If number of quotes is more or equal than number of bars in the chart
if(ticks_stored>=rates_total)
  {
   // Removing the first tick_stored/2 quotes and shifting remaining quotes
   for(i=ticks_stored/2;i<ticks_stored;i++)
     {
      // Shifting the data to the beginning in the TicksBuffer[] array on tick_stored/2
      TicksBuffer[i-ticks_stored/2]=TicksBuffer[i];
     }
   // Changing the quotes counter
   ticks_stored-=ticks_stored/2;
  }
Let's calculate the OHLC values for each candle and place these values to the corresponding indicator buffers:
   // We assign the CandleNumber with a number of invalid candle
   CandleNumber=-1;
   // Search for all the price data available for candle formation
   for(i=0;i<ticks_stored;i++)
     {
      // If this candle is forming already
      if(CandleNumber==(int)(MathFloor((ticks_stored-1)/ticks_in_candle)-MathFloor(i/ticks_in_candle)))
        {
         // The current quote is still closing price of the current candle
         CloseBuffer[CandleNumber]=TicksBuffer[i];
         // If the current price is greater than the highest price of the current candle,
          // it will be a new highest price of the candle
         if(TicksBuffer[i]>HighBuffer[CandleNumber]) HighBuffer[CandleNumber]=TicksBuffer[i];
         // If the current price is lower than the lowest price of the current candle,
          // it will be a new lowest price of the candle
         if(TicksBuffer[i]<LowBuffer[CandleNumber]) LowBuffer[CandleNumber]=TicksBuffer[i];
         // If the candle is bullish, it will have a color with index 2 (green)
         if(CloseBuffer[CandleNumber]>OpenBuffer[CandleNumber]) ColorIndexBuffer[CandleNumber]=2;
         // If the candle is bearish, it will have a color with index 1 (red)
         if(CloseBuffer[CandleNumber]<OpenBuffer[CandleNumber]) ColorIndexBuffer[CandleNumber]=1;
         // If the opening and closing prices are equal, then the candle will have a color with index 0 (grey)
         if(CloseBuffer[CandleNumber]==OpenBuffer[CandleNumber]) ColorIndexBuffer[CandleNumber]=0;
        }
      // If this candle hasn't benn calculated yet
      else
        {
         // Let's determine the index of a candle
         CandleNumber=(int)(MathFloor((ticks_stored-1)/ticks_in_candle)-MathFloor(i/ticks_in_candle));
         // The current quote will be the opening price of a candle
         OpenBuffer[CandleNumber]=TicksBuffer[i];
         // The current quote will be the highest price of a candle
         HighBuffer[CandleNumber]=TicksBuffer[i];
         // The current quote will be the lowest price of a candle
         LowBuffer[CandleNumber]=TicksBuffer[i];
         // The current quote will be the closing price of a candle
         CloseBuffer[CandleNumber]=TicksBuffer[i];
         // The candle will have a color with index 0 (gray)
         ColorIndexBuffer[CandleNumber]=0;
        }
     }
The execution of OnCalculate function is completed by returing of a non-zero value, that means that TicksBuffer[] array already has the data and it isn't necessary to read them at the next call of the function. We place the closing curly bracket at the end of the function.
 // Return from OnCalculate(), return a value, different from zero
 return(rates_total);
}
At the end of the article there is a link that can be used to download the full source code of the indicator.
Conclusion
In this article, we have considered the creation of two tick indicators: the tick chart indicator and "tick candles" indicator.
Translated from Russian by MetaQuotes Ltd.
Original article: https://www.mql5.com/ru/articles/60
 Creating a "Snake" Game in MQL5
 Using the Object Pointers in MQL5
 MetaTrader 5: Publishing trading forecasts and live trading statements via e-mail on blogs, social networks and dedicated websites
 MQL5: Analysis and Processing of Commodity Futures Trading Commission (CFTC) Reports in MetaTrader 5
- Free trading apps
- Over 8,000 signals for copying
- Economic news for exploring financial markets
You agree to website policy and terms of use
Can you please let me know how we can add this to MT4?
Also, can we use the moving average plots on this tick charts?
MT4 does not store historical tick data. You would have to store the tick data yourself. Search the CodeBase as there should be several MT4 versions for Tick Charts.
MT4 does not store historical tick data. You would have to store the tick data yourself. Search the CodeBase as there should be several MT4 versions for Tick Charts.
Thank you for this Interesting article.
Using a file to buffer data was it mandatory ?
Was not it possible to buffer history data in memory, using statis array ?
Regards