
DiNapoli trading system

Contents
- Introduction
- DiNapoli levels: the basics
- Main principles and concepts
- Fibo/DiNapoli extensions
- DiNapoli levels trading technics
- Minesweeper A and Minesweeper B strategies
- DiNapoli levels indicator
- Conclusion
- Reference
1. Introduction
New trading strategies and modifications of classical trading systems appear every day. One of the most famous methods was created by Joe DiNapoli, trader, economist and author of popular books. His widely used system is based on Fibonacci levels.
In this article, we will have a close look at the system. I have made my best to explain the basic concepts and trading principles that otherwise cannot be described without close acquaintance with Fibo levels. So, what are these levels? How to interpret and apply them in practice? And most importantly, how do they work in trading?
2. DiNapoli levels: the basics
DiNapoli levels basics
Let's consider the general principles of trading DiNapoli levels, including how to correctly plot them on charts, interpret their readings relative to the price movement and apply them to define market entry points.
As I have already said, DiNapoli strategy is based on Fibo levels. Only the horizontal markup is used in this method. Fibo arcs and fans are not applied.
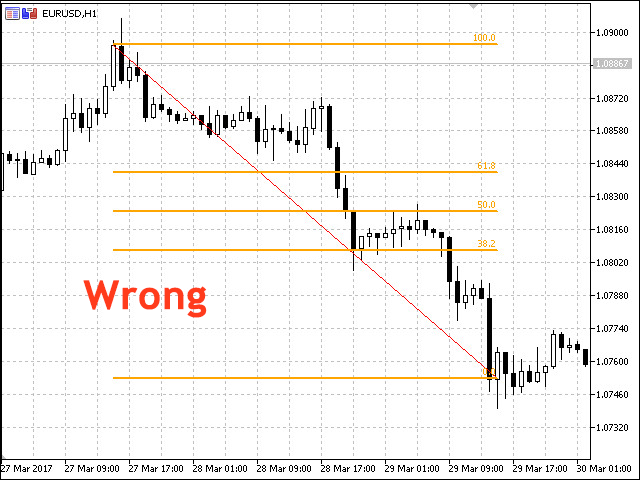
Wrong placement of Fibo levels
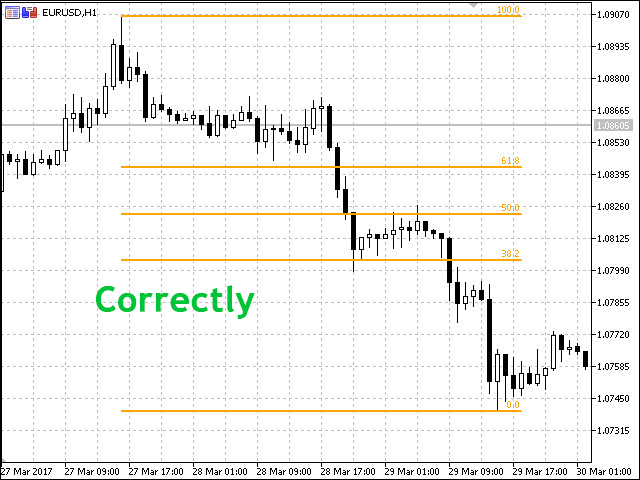
Correct placement of Fibo levels
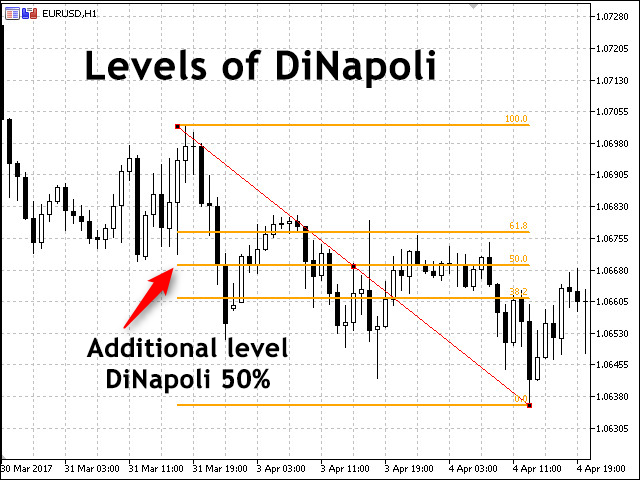
DiNapoli levels are inherently support and resistance levels, although their interpretation is more deep as compared to conventional levels. They are based on Fibo levels and apply the so-called market swing (see below) or, more simply, a trend. We need only three Fibo levels to build DiNapoli ones: 61.8%, 50% and 38.2%. These are the levels to be used on your chart as support and resistance ones. The Fibo levels are plotted upwards in case of an uptrend and downwards in case of a downtrend.
Ideally, the lines are arranged from 0% to 100% in the direction of the current trend. All Fibo levels exceeding 100% are used to set position closing points.
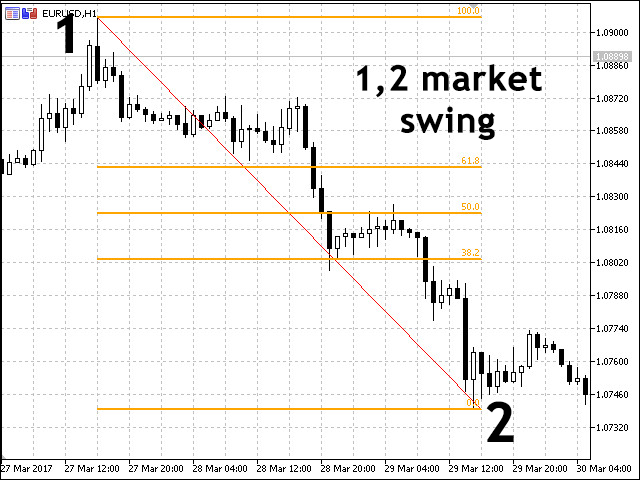
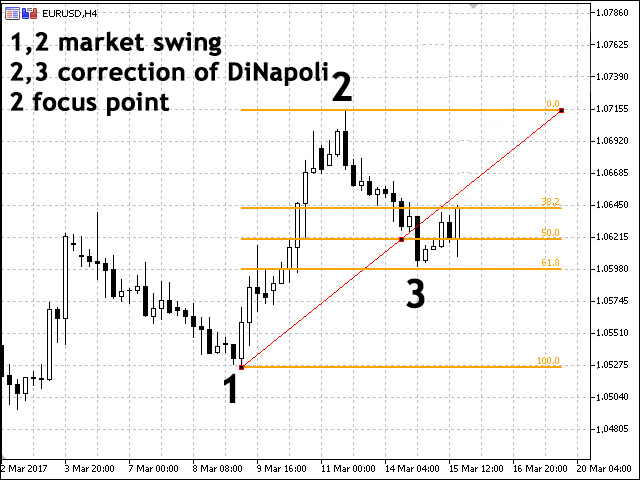
Market swing
DiNapoli levels can be applied in two ways — as an extension and correction.
Correction is applied for detecting target entry points, while an extension grid is built for detecting market exit points.
3. Main principles and concepts
- Fibo node — price chart point, at which correction movement ends. Joe DiNapoli advised to work only with nodes found between 38.2% and 61.8%. All nodes located below 38.2% are too insignificant, while the ones exceeding 61.8% are too strong (meaning a trend may not recover).
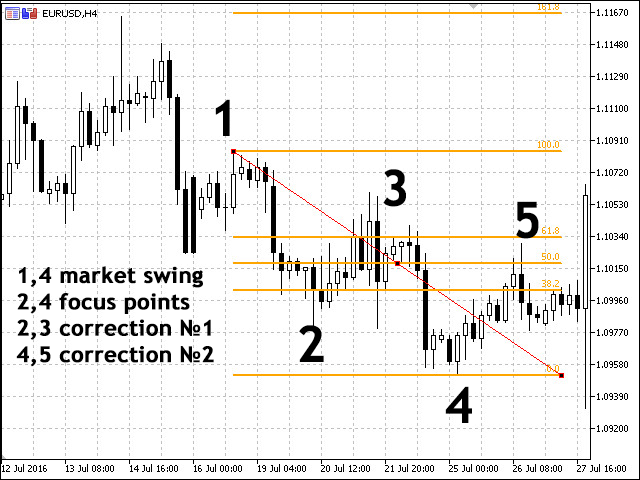
- Market swing (distance between extremums) — distance from the beginning to the end of the price movement, the Fibo levels are plotted on. If the price changes its High or Low point after the end of the correction, you should also move the extreme point of the levels. In this case, the swing increases.
- Accumulation — place on a chart where an accumulation of several Fibo nodes (multiple correction levels close to each other) is detected.
- Focus point (extremum) — extreme point of the market swing (level the price correction starts from). When an extremum changes, another focus point appears on a chart. Thus, there may be multiple points on the chart in one swing zone.
- Target level — point on a price chart where you want to place a take profit.
- Target point — any chart point an action is planned at (market entry, market exit, etc.).
- Reaction — finished correction in a trend movement. Several reactions may form in a single swing radius.
Extensions, correction and focus point
A price chart is constantly moving, and each time market swings should be corrected relative to the chart. In this case, the swings are expanded each time leading to changes in the number of focus points on the chart. Price corrections called "reactions" appear in the center of the market swings. Each of them has its own index.
Reactions on the chart
Tips from DiNapoli
- Signals received from the levels produce results only if correction levels as well as accumulations/support levels are located within the levels range of 38.2%-61.8%. Other signals are ignored.
- Use common Fibo levels reaching the last correction as take profit levels in order to place a stop loss on 161.8% and 261.8%.
- The number of swings on the chart is always equal to the amount of focus numbers.
- Focus numbers are always located to the right of the reactions they are connected with. In other words, price corrections formed on the levels swings should be located to the left of the focus number.
- The higher the timeframe, the lesser the number of reactions. As you may have already noticed, when working on different timeframes, the price movement is quite fast on small time periods, whereas these movements are not even displayed on higher ones.This rule is also used in the reverse order: when the price detects a strong resistance/support, you are able to find necessary reactions and swings that are not displayed on higher timeframes by using lower ones.
4. Fibo/DiNapoli extensions
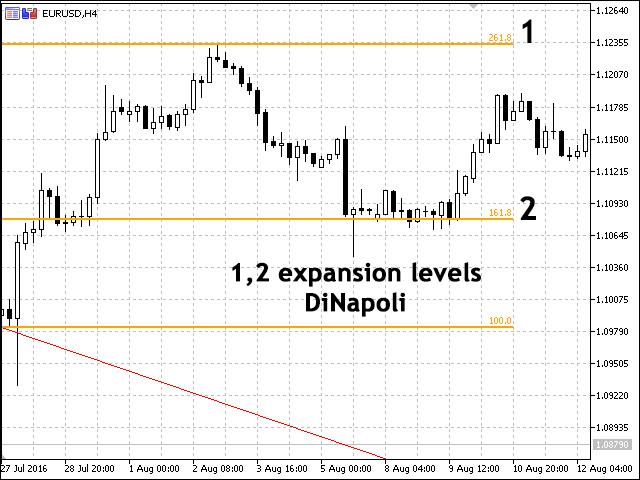
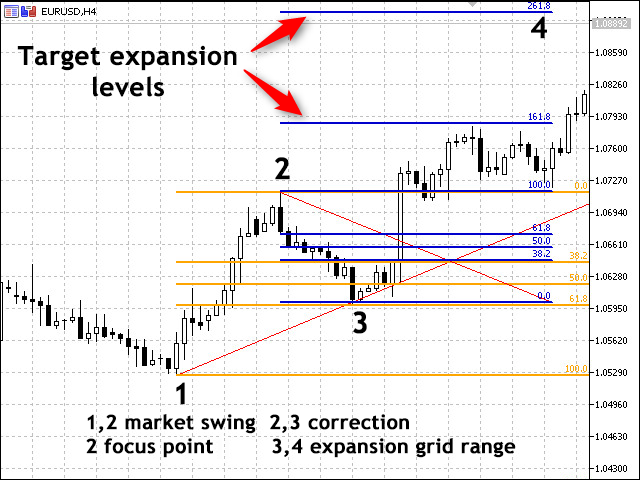
DiNapoli extensions grid allows us to define market exit points based on Fibo extensions grid. This time, we will use the levels of 100%, 161.8% and 261.8% that are target points for setting a take profit.
Fibo (DiNapoli) levels extensions
The Fibo extensions grid is built the following way:
- For a downtrend — starting with a Low price to the price correction peak formed by the price roll-back line beginning from 38.2% and higher.
- For an uptrend — starting with a Low price to the price correction minimum crossing the level of 38.2% and higher.
Placing the Fibo extensions grid on a chart
In his book "Trading with DiNapoli Levels", the author pays much attention to such concepts as "Multiple focus numbers" and "Market swings". These patterns are typical when trading instruments with frequent flats. Such patterns are more complex than simple swings. The main difficulty is sorting out unnecessary levels.
Let me briefly list the conclusions I made after reading the book. The book's indisputable advantages lie in the fact that it was written not by a theorist, but by an experienced trader and manager. Another solid argument in its favor is the use of Fibo levels that passed through a centuries-old time test and are mathematically balanced and verified. Besides, examples provided in the book describe not only commodity and stock markets, but also currency futures trading, and its principles can be applied to the Forex market.
Many new concepts introduced by DiNapoli also require careful study and comprehensive understanding.
5. DiNapoli levels trading technics
Now, let's consider trading using DiNapoli levels. In short, its basic idea described in his book allows us to develop several trading tactics with "aggressive" and "quiet" levels.
- The aggressive one features two market entry methods: the Bushes and Bonsai strategies. The trading principle is similar, the only difference being the placement of stop losses.
- The quiet strategy also describes the two methods: Minesweeper A and B.
When applying the aggressive trading method, it is assumed that the price rolls back from the level of 38.2% and the already formed swing. The only difference between the Bushes and Bonsai strategies is the Fibo level, after which a stop loss is set.
Let's start from the Bushes trading method. According to this method, positions should be opened the moment the price on the generated corrections grid crosses the level of 38.2% in the current trend direction, while a stop loss is placed further than the level of 50%. According to the Bonsai method, the market entry is similar to the Bushes one, although a stop loss is set stop short of the Fibo level of 50%.
Following these methods is assumed to be aggressive since there is a risk that the price roll-back on the chart may not happen. It is quite common for the correction to turn into a new trend, or the price may enter flat just for a short while. Therefore, if you decide to apply this method, wait for a full confirmation of the signal to be on the safe side.

The Bushes strategy
The book also describes some of the negative features of the Bonsai strategy. DiNapoli emphasizes that a considerable slippage is probable when executing a stop order in that case, since there is no powerful level meaning insufficient number of trades and no solid request matching. Thus, the choice depends on a brokerage company and a trading platform. On the other hand, if you trade highly liquid instruments with a small volume in the market, such situation is unlikely.
6. Minesweeper A and Minesweeper B strategies
The most quiet and less risky strategies are Minesweeper A and B. According to them, a market entry should be performed after a correction, while the trading itself is conducted using safety measures.
- Minesweeper A. First, we wait for the initial correction to finish (no market entry), then for the second correction to form. Only after that, we open positions. A stop loss is placed the same way as in the previous strategy, i.e. behind the next Fibo level.
- Minesweeper B. Instead of opening positions after the second formed correction, they are opened after the third, fourth or even later ones. In other words, we enter the market only after the trend is thoroughly confirmed meaning the risk of false signal is considerably reduced.
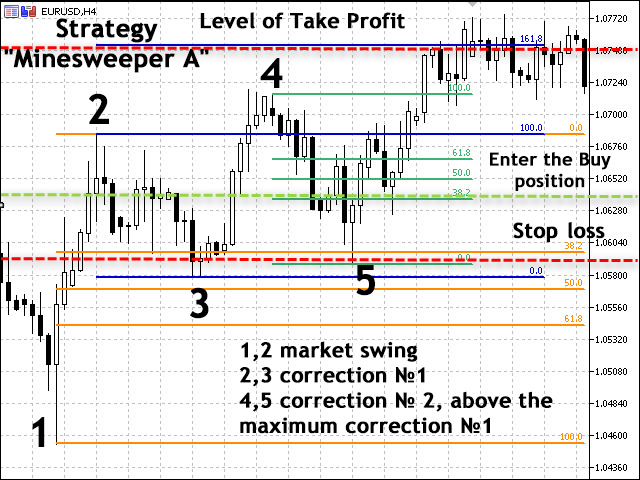
Minesweeper A strategy
If you come across a rather long-living trend featuring multiple corrections (reactions) and follow all the analysis rules, your chart is quickly littered with many unimportant levels and lines. Most of them can be simply discarded as redundant data that do not fall under the rules for trading DiNapoli levels.
Suppose that you see a powerful uptrend with a few reactions. At some time, you have a correction of all upward movements. As a result, the price starts re-writing the Lows of some reactions. Such reactions should be canceled and their Lows should be discarded.
7. DiNapoli levels indicator
For those unwilling to spend their time plotting DiNapoli levels manually by placing Fibo levels, there is an indicator doing that automatically. The indicator is attached below. It can also be found in the CodeBase. Let's analyze its operation in more details. The indicator name has been changed for more convenience.
The indicator is installed in a usual way by placing the file to the Indicators folder of the MetaTrader 5 root directory. It does not have too much settings most of them being level colors. The colors are customizable, but I do not recommend changing them if you are a novice in order to avoid display and market analysis errors.
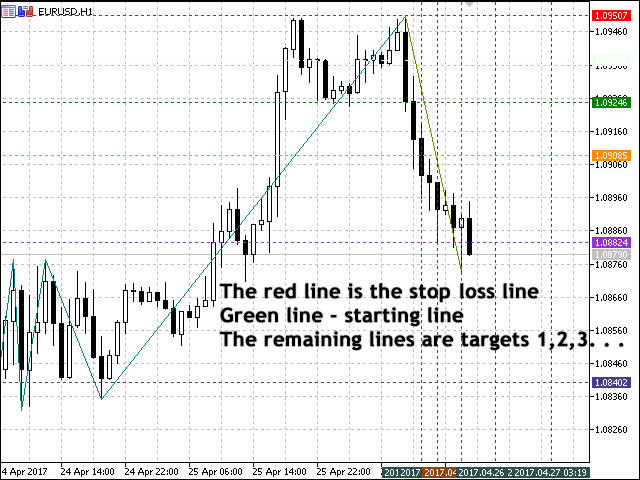
The indicator for auto display of DiNapoli levels also includes Zigzag with a ZigZag reversal audio signal. The red line marks the place for placing a stop loss on the chart, while the blue one shows the operation start level. The remaining horizontal lines are price target ones. Besides, the indicator shows the vertical time layout lines (they can be disabled in the indicator settings).

Indicator inputs
Displaying DiNapoli Levels on the terminal price chart
Inputs:
- Minimum points in a ray (default = 400) – change the width of the vertical time levels;
- Show the vertical lines (default = true) – show/hide vertical time levels;
- Number of history bars (default = 5000) – number of history bars used by the built-in ZigZag indicator;
- Play sound (default = true) – enable audio notifications on ZigZag changing its direction;
- Sound file (default = "expert.wav") – select an audio notification file;
- Start Line color (default = Blue) – start horizontal line color;
- Stop Line color (default = Red) – color of a horizontal line for setting a stop loss;
- Target1 Line color (default = Green) – color of a horizontal line for the target 1;
- Target2 Line color (default = DarkOrange) – color of a horizontal line for the target 2;
- Target3 Line color (default = DarkOrchid) – color of a horizontal line for the target 3;
- Target4 Line color (default = DarkSlateBlue) – color of a horizontal line for the target 4;
- Time Target1 color (default = DarkSlateGray) – vertical time line 1 color;
- Time Target2 color (default = SaddleBrown) – vertical time line 2 color;
- Time Target3 color (default = DarkSlateGray) – vertical time line 3 color;
- Time Target4 color (default = DarkSlateGray) – vertical time line 4 color.
First, let's introduce the basic indicator parameters, on which the entire code is built.
The initial code parameters look as follows:
//------------------------------------------------------------------------------------
//                                                                 DiNapoli Levels.mq5
//                                                   The modified indicator FastZZ.mq5
//                                       Added DiNapoli Target Levels and Time Targets
//                                                         victorg, www.mql5.com, 2013
//------------------------------------------------------------------------------------
#property copyright   "Copyright 2012, Yurich"
#property link        "https://login.mql5.com/en/users/Yurich"
#property version     "3.00"
#property description "FastZZ plus DiNapoli Target Levels."
#property description "The modified indicator 'FastZZ.mq5'."
#property description "victorg, www.mql5.com, 2013."
//------------------------------------------------------------------------------------
#property indicator_chart_window // Display the indicator in the chart window
#property indicator_buffers 3    // The number of buffers to calculate the indicator
#property indicator_plots   1    // Number of indicator windows
#property indicator_label1  "DiNapoli Levels" // Set the label for the graphics series
#property indicator_type1   DRAW_COLOR_ZIGZAG // Drawing style of the indicator. N - number of the graphic series
#property indicator_color1  clrTeal,clrOlive  // The color for the N line output, where N is the number of the graphics series
#property indicator_style1  STYLE_SOLID       // Line Style in the Graphics Series
#property indicator_width1  1    // Line thickness in the graphics series
//------------------------------------------------------------------------------------
input int    iDepth=400;              // Minimum of points in the ray
input bool   VLine=true;              // Show Vertical Lines
input int    iNumBars=5000;           // Number of bars in history
input bool   Sound=true;              // Enable sound notifications
input string SoundFile="expert.wav";  // Audio file
input color  cStar=clrBlue;           // Color of the start line
input color  cStop=clrRed;            // Stop line color
input color  cTar1=clrGreen;          // Color of the goal line #1
input color  cTar2=clrDarkOrange;     // Color of the goal line # 2
input color  cTar3=clrDarkOrchid;     // Color of the goal line # 3
input color  cTar4=clrDarkSlateBlue;  // Color of the goal line #4
input color  cTarT1=clrDarkSlateGray; // Color of the time line #1
input color  cTarT2=clrDarkSlateGray; // Color of the time line #2
input color  cTarT3=clrSaddleBrown;   // Color of the time line #3
input color  cTarT4=clrDarkSlateGray; // Color of the time line #4
input color  cTarT5=clrDarkSlateGray; // Color of the time line #5
Let's enter the variables in the indicator.
//Main variables
double   DiNapoliH[],DiNapoliL[],ColorBuffer[],Depth,A,B,C,Price[6];
int      Last,Direction,Refresh,NumBars;
datetime AT,BT,CT,Time[5];
color    Color[11];
string   Name[11]={"Start Line","Stop Line","Target1 Line","Target2 Line",
                   "Target3 Line","Target4 Line","Time Target1","Time Target2",
                   "Time Target3","Time Target4","Time Target5"};
After setting the main parameters and entering the variables, it is time to develop the main part of the indicator.
Main part:
// Begin the initialization of the indicator
void OnInit()
  {
  int i;
  string sn,sn2;

// Set the conditions for the points in the ray
  if(iDepth<=0)Depth=500;
  else Depth=iDepth;

// Set the conditions for bars in history
  if(iNumBars<10)NumBars=10;
  else NumBars=iNumBars;

// Set up displaying indicator buffers
  SetIndexBuffer(0,DiNapoliH,INDICATOR_DATA);
  SetIndexBuffer(1,DiNapoliL,INDICATOR_DATA);
  SetIndexBuffer(2,ColorBuffer,INDICATOR_COLOR_INDEX);

// Set the accuracy of displaying the indicator values
  IndicatorSetInteger(INDICATOR_DIGITS,Digits());

// Set up the drawing of lines
  PlotIndexSetDouble(0,PLOT_EMPTY_VALUE,0.0);
  PlotIndexSetDouble(1,PLOT_EMPTY_VALUE,0.0);

// Set up a short name for the indicator
  sn="DiNapoli"; sn2="";
  for(i=1;i<100;i++)
    {
// Set up a chart search
    if(ChartWindowFind(0,sn)<0){break;}
    sn2="_"+(string)i; sn+=sn2;
    }

// Set the symbol display
  IndicatorSetString(INDICATOR_SHORTNAME,sn);
  for(i=0;i<11;i++) Name[i]+=sn2;

// Initialize the buffers with empty values
  ArrayInitialize(DiNapoliH,0); ArrayInitialize(DiNapoliL,0);
Let's proceed developing the indicator:
// Adjust the color lines of the indicator
  Color[0]=cStar; Color[1]=cStop; Color[2]=cTar1; Color[3]=cTar2;
  Color[4]=cTar3; Color[5]=cTar4; Color[6]=cTarT1; Color[7]=cTarT2;
  Color[8]=cTarT3; Color[9]=cTarT4; Color[10]=cTarT5;
  Depth=Depth*_Point;
  Direction=1; Last=0; Refresh=1;
  for(i=0;i<6;i++)
    {
    if(ObjectFind(0,sn)!=0)
      {

// Set up horizontal and vertical lines
      ObjectCreate(0,Name[i],OBJ_HLINE,0,0,0);
      ObjectSetInteger(0,Name[i],OBJPROP_COLOR,Color[i]);
      ObjectSetInteger(0,Name[i],OBJPROP_WIDTH,1);
      ObjectSetInteger(0,Name[i],OBJPROP_STYLE,STYLE_DOT);
//    ObjectSetString(0,Name[i],OBJPROP_TEXT,Name[i]);// Object description
      }
    }
  if(VLine==true)
    {
    for(i=6;i<11;i++)
      {
      if(ObjectFind(0,sn)!=0)
        {
        ObjectCreate(0,Name[i],OBJ_VLINE,0,0,0);
        ObjectSetInteger(0,Name[i],OBJPROP_COLOR,Color[i]);
        ObjectSetInteger(0,Name[i],OBJPROP_WIDTH,1);
        ObjectSetInteger(0,Name[i],OBJPROP_STYLE,STYLE_DOT);
//      ObjectSetString(0,Name[i],OBJPROP_TEXT,Name[i]);// Object description
        }
      }
    }
  }

// Add function when the indicator is removed from the graph, graphic objects are deleted from the indicator
void OnDeinit(const int reason)
  {
  int i;

  for(i=0;i<11;i++) ObjectDelete(0,Name[i]);
  ChartRedraw();
  return;
  }
Now, let's calculate the indicator buffers:
// Function of iteration of the indicator
int OnCalculate(const int total,        // Size of the input timeseries
                const int calculated,   // Processed bars call
                const datetime &time[], // Array with time values
                const double &open[],   // Array with opening prices
                const double &high[],   // Array for copying the maximum prices
                const double &low[],    // Array of minimum prices
                const double &close[],  // The closing price array
                const long &tick[],     // Parameter containing the history of the tick volume
                const long &real[],     // Real volume
                const int &spread[])    // An array containing the spreads history

  {
  int i,start;
  bool set;
  double a;

// Set the bar check
  if(calculated<=0)
    {
    start=total-NumBars; if(start<0)start=0;

// Initialize the buffers with empty values
    Last=start; ArrayInitialize(ColorBuffer,0);
    ArrayInitialize(DiNapoliH,0); ArrayInitialize(DiNapoliL,0);
    }

// Calculation of a new bar
  else start=calculated-1;
  for(i=start;i<total-1;i++)
    {
    set=false; DiNapoliL[i]=0; DiNapoliH[i]=0;
    if(Direction>0)
      {
      if(high[i]>DiNapoliH[Last])
        {
        DiNapoliH[Last]=0; DiNapoliH[i]=high[i];
        if(low[i]<high[Last]-Depth)
          {
          if(open[i]<close[i])
            {
            DiNapoliH[Last]=high[Last];
            A=C; B=high[Last]; C=low[i];
            AT=CT; BT=time[Last]; CT=time[i];
            Refresh=1;
            }
          else
            {
            Direction=-1;
            A=B; B=C; C=high[i];
            AT=BT; BT=CT; CT=time[i];
            Refresh=1;
            }
          DiNapoliL[i]=low[i];
          }

// Set the line colors
        ColorBuffer[Last]=0; Last=i; ColorBuffer[Last]=1;
        set=true;
        }
      if(low[i]<DiNapoliH[Last]-Depth&&(!set||open[i]>close[i]))
        {
        DiNapoliL[i]=low[i];
        if(high[i]>DiNapoliL[i]+Depth&&open[i]<close[i])
          {
          DiNapoliH[i]=high[i];
          A=C; B=high[Last]; C=low[i];
          AT=CT; BT=time[Last]; CT=time[i];
          Refresh=1;
          }
        else
          {
          if(Direction>0)
            {
            A=B; B=C; C=high[Last];
            AT=BT; BT=CT; CT=time[Last];
            Refresh=1;
            }
          Direction=-1;
          }

// Set the line colors
        ColorBuffer[Last]=0; Last=i; ColorBuffer[Last]=1;
        }
      }
    else
      {
      if(low[i]<DiNapoliL[Last])
        {
        DiNapoliL[Last]=0; DiNapoliL[i]=low[i];
        if(high[i]>low[Last]+Depth)
          {
          if(open[i]>close[i])
            {
            DiNapoliL[Last]=low[Last];
            A=C; B=low[Last]; C=high[i];
            AT=CT; BT=time[Last]; CT=time[i];
            Refresh=1;
            }
          else
            {
            Direction=1;
            A=B; B=C; C=low[i];
            AT=BT; BT=CT; CT=time[i];
            Refresh=1;
            }
          DiNapoliH[i]=high[i];
          }

// Set the line colors
        ColorBuffer[Last]=0; Last=i; ColorBuffer[Last]=1;
        set=true;
        }
      if(high[i]>DiNapoliL[Last]+Depth&&(!set||open[i]<close[i]))
        {
        DiNapoliH[i]=high[i];
        if(low[i]<DiNapoliH[i]-Depth&&open[i]>close[i])
          {
          DiNapoliL[i]=low[i];
          A=C; B=low[Last]; C=high[i];
          AT=CT; BT=time[Last]; CT=time[i];
          Refresh=1;
          }
        else
          {
          if(Direction<0)
            {
            A=B; B=C; C=low[Last];
            AT=BT; BT=CT; CT=time[Last];
            Refresh=1;
            }
          Direction=1;
          }
// Set the line colors
        ColorBuffer[Last]=0; Last=i; ColorBuffer[Last]=1;
        }
      }
    DiNapoliH[total-1]=0; DiNapoliL[total-1]=0;
    }
//------------
  if(Refresh==1)
    {
The final cycle of calculating the indicator:
// Check the number of bars for sufficiency for calculation
    Refresh=0; a=B-A;
    Price[0]=NormalizeDouble(a*0.318+C,_Digits);           // Start;
    Price[1]=C;                                            // Stop
    Price[2]=NormalizeDouble(a*0.618+C,_Digits);           // Target№1
    Price[3]=a+C;                                          // Target№2;
    Price[4]=NormalizeDouble(a*1.618+C,_Digits);           // Target№3;
    Price[5]=NormalizeDouble(a*2.618+C,_Digits);           // Target№4;
    for(i=0;i<6;i++) ObjectMove(0,Name[i],0,time[total-1],Price[i]);
    if(VLine==true)
      {

// Return the value rounded to the nearest integer of the specified value
      a=(double)(BT-AT);
      Time[0]=(datetime)MathRound(a*0.318)+CT;             // Temporary goal number №1
      Time[1]=(datetime)MathRound(a*0.618)+CT;             // Temporary goal number №2
      Time[2]=(datetime)MathRound(a)+CT;                   // Temporary goal number №3
      Time[3]=(datetime)MathRound(a*1.618)+CT;             // Temporary goal number №4
      Time[4]=(datetime)MathRound(a*2.618)+CT;             // Temporary goal number №5
      for(i=6;i<11;i++) ObjectMove(0,Name[i],0,Time[i-6],open[total-1]);
      }
    ChartRedraw();

// If the direction is changed then turn on the audio playback
    if(Sound==true&&calculated>0)PlaySound(SoundFile);
    }
  return(total);
  }
//------------------------------------------------------------------------------------
The indicator is attached below.
8. Conclusion
I hope, this article has provided you with sufficient data on applying DiNapoli method in trading. The DiNapoli levels offer an original approach to working with standard Fibo levels and extensions. The core principle of working with levels remains the same. DiNapoli has simply introduced a number of new rules yielding reliable results on the market when properly applied.
Programs used in the article:
| # | Name |
Type |
Description |
|---|---|---|---|
| 1 | DiNapoli Levels.mq5 | Indicator | The indicator for DiNapoli levels auto calculation and plotting |
9. Reference
- Joe DiNapoli. DiNapoli Levels: The Practical Application of Fibonacci Analysis to Investment Markets. Coast Investment Software, Inc; Second Edition (1998)
Translated from Russian by MetaQuotes Ltd.
Original article: https://www.mql5.com/ru/articles/3061
 Cross-Platform Expert Advisor: Money Management
- Free trading apps
- Over 8,000 signals for copying
- Economic news for exploring financial markets
You agree to website policy and terms of use
Correctly set the levels you need as in the first screenshot.
Hi
Can someone help me on how to use this Indicator within a EA that I am using for back testing. When the Ontick() is called, it has to fetch data from the DiNapoli indicator and give me the price information for start line, stop line, target line e.t.c
I placed the indicator code available within Oncalculate into a function called DiNapoli_Levels(parqm1, param2,etc //same parameters available within Oncalculate). But to call this on Ontick function, I need to know the parameters to supply for this function. I have clue on what values needs to be passed. Please if someone can help, it would really great..
Thanks.
Hi, please is ther any indicator for mt4 for dinapoli levels? I dont like the indicator name dinapoli targets. is it the same, dinapoli levels indicator and dinapoli targets?
Yes, the screenshot has not been replaced by the correct one, we will soon fix it.
Correctly set the levels you need as in the first screenshot.
Hi, please is ther any indicator for mt4 for dinapoli levels? I dont like the indicator name dinapoli targets. is it the same, dinapoli levels indicator and dinapoli targets?
This is a very fantastic indicator. Thank you so much for sharing this.