
Learn how to trade the Fair Value Gap (FVG)/Imbalances step-by-step: A Smart Money concept approach

Introduction
In this article, we will discuss the basic steps towards the crafting and development of an expert advisor (EA), based on the fair value gap (FVG)/imbalance strategy and a smart money concept approach. In essence, the journey towards creating an expert advisor rooted in the Fair Value Gap strategy represents a convergence of art and science, typically requiring a trader to be able to not only analyze the candlesticks but also draw to visualize the concept levels. Join us as we unravel the mysteries of smart money and embark on a quest to harness its transformative power in the realm of algorithmic trading. We will craft the Expert Advisor with a Fair Value Gap via the following topics:
- Imbalance definition
- Trading strategy description
- Trading strategy blueprint
- Trading system in MQL5
- Strategy tester results
- Conclusion
On this journey, we will extensively use MetaQuotes Language 5 (MQL5) as our base IDE coding environment, and execute the files on MetaTrader 5 (MT5) trading terminal. Thus, it will be of prime importance having the aforementioned versions. Let's get started then.
Fair Value Gap (FVG)/Imbalance defination
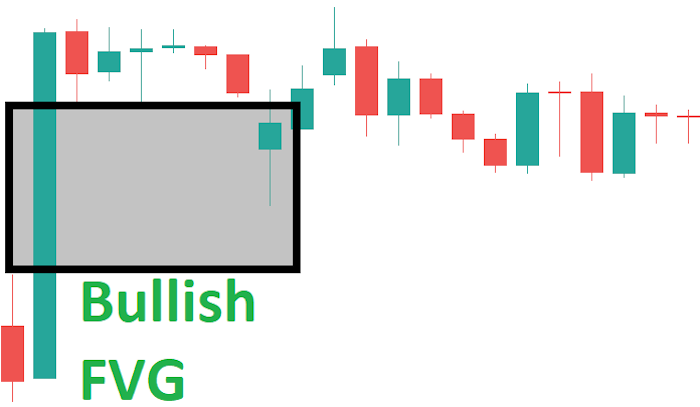
The fair value gap delineates the difference between imbalances caused by both buying and selling pressures. Typically, they will occur when there is high volatility that completely drives either the bears or the bulls out of the market, and thus, unequal market pressures develop. This is typically characterized by massive uni-directional movements in the market. Usually, you will notice long candlesticks on the chart. Armed with this knowledge, we can employ various approaches to exploit the fair value gap and potentially create a trading strategy.
Fair Value Gap (FVG) trading strategy description
The fair value gap trading strategy integrates the concept of fair value assessment with candlestick imbalances to identify potential trading opportunities.
Here's a detailed description of the fair value gap trading strategy incorporating candlestick imbalances:
- Traders conduct a comprehensive fundamental analysis to determine fair value gaps. This is achieved by analyzing the market price action using candlestick patterns to identify imbalances between the buying and selling pressures. Candlestick patterns, such as bullish engulfing, bearish engulfing, and doji, offer insights into market sentiment and potential shifts in momentum. Traders look for instances where the market price significantly deviates from the estimated fair value while also observing notable candlestick imbalances. A wide gap between the closing price of the previous session and the opening price of the current session, coupled with strong bullish or bearish candlestick patterns, may indicate a potential fair value gap. The hardest aspect of the fair value gap approach, like other chart patterns, is spotting this special configuration on a price chart. FVGs require the appearance of a three-candle design with particular guidelines. When this occurs, the fair value gap is the area or distance between the wicks of the first and third candles.
The following is how to spot a FVG on the chart:
- Finding the Big Candlestick: The first thing to do when trying to figure out a Fair Value Gap is to search your price chart for a large candlestick. There should be a noticeable body-to-wick ratio on this candlestick—ideally, 70%.
- Examining Adjacent Candlesticks: After you've located the enormous candlestick, examine the ones that are right in front of and behind it. The important candlestick shouldn't completely overlap with these nearby candlesticks. Rather, there might be slight overlaps on the significant candlestick's upper and lower sides. The fair-value gap is then caused by the space between the wicks of adjacent candlesticks.
- Determining the Fair Value Difference: The fair value gap must be defined and depicted on your pricing chart as the last step. The price range between the high and low of the preceding candlestick in a bearish trend is known as the fair value gap. This is where the market's imbalance shows itself and could present a trading opportunity. Likewise, a bullish trend holds true, but with opposite conditions.
- Entry and Exit Signals: Upon identifying a fair value gap accompanied by significant candlestick imbalances, traders execute trades accordingly. For instance, if the market price is lower than the estimated fair value and a bullish engulfing pattern emerges, traders may consider entering a long position, anticipating a price correction. Conversely, if the market price is higher than the fair value and a bearish engulfing pattern appears, traders may initiate a short position.
- Risk Management: Traders implement risk management techniques, such as setting stop-loss orders and position sizing, to mitigate potential losses in case the trade does not unfold as anticipated.
- Monitoring and Adjustment: Traders continuously monitor the trade, adjusting their positions based on evolving market conditions and reassessment of fair value estimates.
As you have already noticed, there are two different varieties of Fair Value Gaps, each with unique ramifications for traders. A detailed description is as below:
-
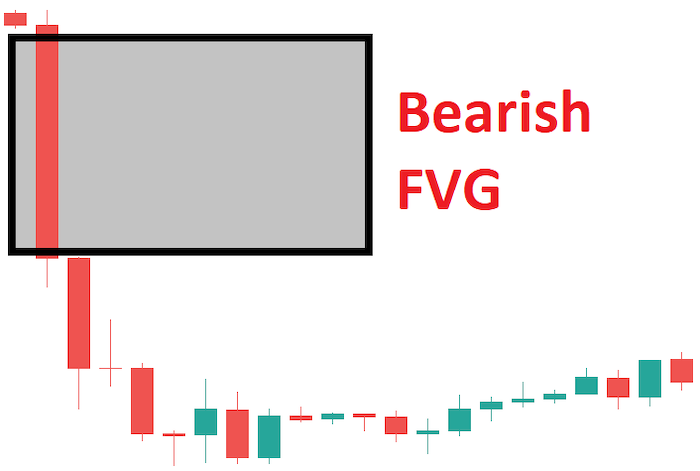
Bearish Fair Value Gap, or Undervalued Fair Value Gap
This kind of FVG indicates that a currency pair's price, or the price of any other financial asset, is currently less than its fair value. To put it simply, traders can expect a market retracement to address this inefficiency. If you see a large bearish candlestick on your chart, it probably indicates that there is an undervalued FVG.
-
Bullish Fair Value Gap, or Overrated Fair Value Gap
On the other hand, an overrated FVG shows that a financial asset or currency pair is now trading above its fair value. The market is overheated here, and a correction is imminent. Before rising, traders should anticipate a price retracement as the market corrects itself.
Fair Value Gap (FVG) trading strategy blueprint
After defining and describing the Fair Value Gap strategy, let us now define the designated conditions step-by-step that need to be considered to trade the FVG strategy. Recall that two types of FVGs could form on the market.
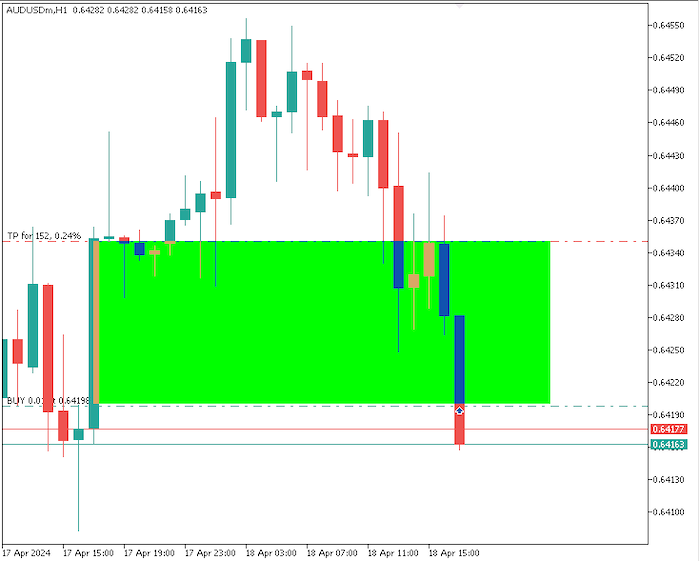
- Bullish FVG: According to the strategy, we need to find a bullish candlestick that has major price movement and then assess the neighboring candles—to the left and the right. If this is true, then we proceed to get the difference between the third candle and the first candle in a time series manner, and if the difference is not within the restricted predefined points, we have a bullish FVG that we will trade accordingly. The FVG becomes our point of interest, and we document it in the algorithm. We concurrently draw the FVG, colored green/lime on the chart, with a predefined length for visualization purposes, signaling that we did find a bullish FVG setup and that we are cool to trade the setup. So now, if the price comes back and touches the lower FVG area, we send an instant market buy order. The take profit will be set at the upper part of the FVG, while the stop loss is set below the opening price of the order, with a risk-to-reward ratio of 1:3. However, if the price does not revert to the FVG setup after the predefined length, we just get it out of our concern.
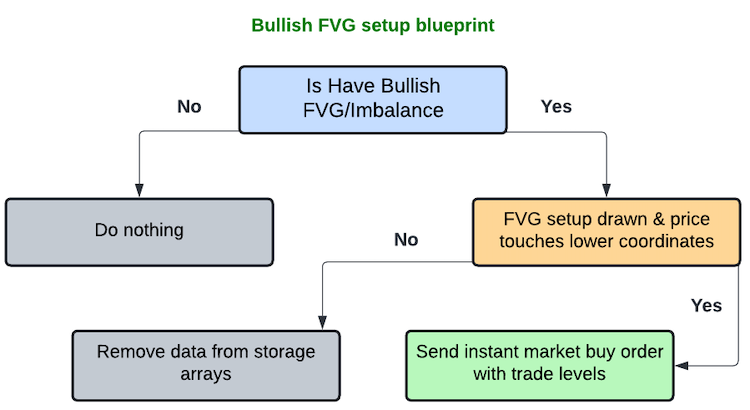
The same process continues for all other bullish FVG setups.
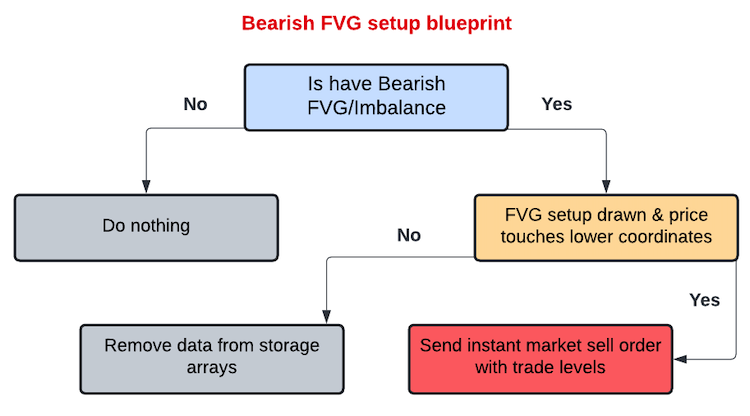
- Bearish FVG: Again, here, we need to find a bearish candlestick that has major price movement and then assess the neighboring candles—to the left and the right. If this is true, then we proceed to get the difference between the third candle and the first candle in a time series manner, and if the difference is not within the restricted predefined points, we have a bearish FVG that we will trade accordingly. The FVG becomes our point of interest, and we document it in the algorithm. We concurrently draw the FVG, colored red/ tomato, on the chart with a predefined length for visualization purposes, signaling that we did find a bearish FVG setup and that we are cool to trade the setup. So now, if the price comes back and touches the upper FVG area, we send an instant market sell order. The take profit will be set at the lower part of the FVG, while the stop loss is set above the opening price of the order, with a risk-to-reward ratio of 1:10. However, if the price does not revert to the FVG setup after the predefined length, we just get it out of our concern.
The same process continues for all other bearish FVG setups.
Fair Value Gap (FVG) trading system in MQL5
After learning all the theory about FVG trading strategy, let us then automate the theory and craft an Expert Advisor (EA) in MQL5 for MetaTrader 5.
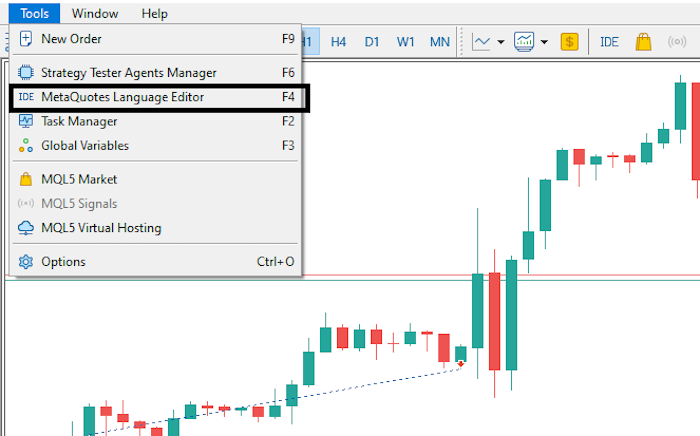
To create an EA, on your MetaTrader 5 terminal, click the Tools tab and check MetaQuotes Language Editor, or simply press F4 on your keyboard. This will open the MetaQuotes Language Editor environment, which allows the writing of trading robots, technical indicators, scripts, and libraries of functions.
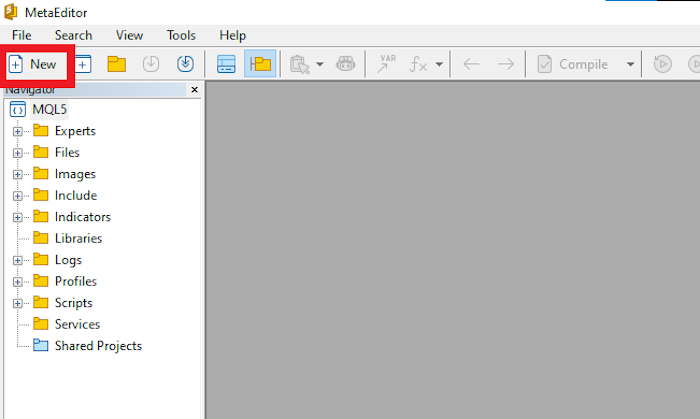
Now click New, check Expert Advisor (template) & click Next.

Then provide your desired expert advisor file name, click Next, click Next, and then click Finish. After doing all that, we are now ready to code and program our FVG strategy.
First, we include a trade instance by using #include at the beginning of the source code. This gives us access to the CTrade class, which we will use to create a trade object.
#include <Trade/Trade.mqh>
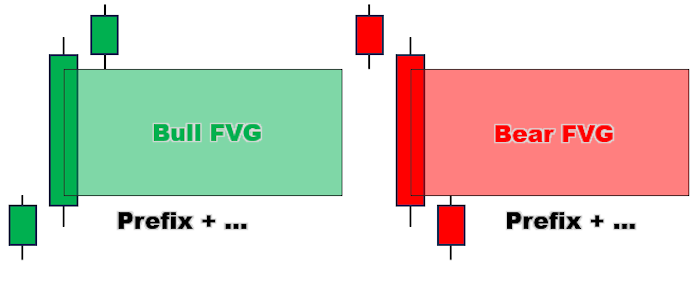
CTrade obj_Trade; Again, we use #define to define a variable that we will assign as a prefix to all created FVG rectangles and their colors.
#define FVG_Prefix "FVG REC "
#define CLR_UP clrLime
#define CLR_DOWN clrRed
Below is the illustration of the importance of the aforementioned parameters.
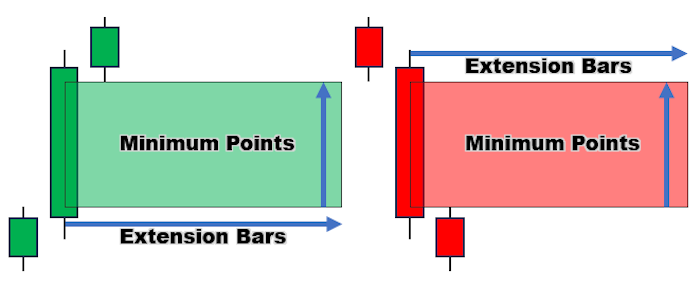
We will need to predefine some other variables to further ease the coding of the EA. These are the minimum points for an imbalance bar range for it to be considered viable, and the length of the drawn rectangle is, in this case, the bars of extension from the central imbalance bar. We will define these as global variables.
int minPts = 100;
int FVG_Rec_Ext_Bars = 10;
Below is the illustration. We define minPts for minimum points and FVG_Rec_Bars for the range in bars in which the rectangle length will depict.
Lastly, we define four arrays, of string, integer, datetime, and boolean data type variables, which will hold and store our data used in the creation of the EA. These are again globals.
string totalFVGs[];
int barINDICES[];
datetime barTIMEs[];
bool signalFVGs[];
On the OnInit section, we search for the FVG setups for only the visible bars on the chart. This will give our EA a more indicator-dominance like touch. So, if the user initiates the chart, they are still able to view the prior FVG setups and they await more to be created on the preceeding candlesticks.
First, we get all the visible bars on the chart and inform of their count.
   int visibleBars = (int)ChartGetInteger(0,CHART_VISIBLE_BARS);
   Print("Total visible bars on chart = ",visibleBars);
If there are no rectangle objects on the chart, we free and resize the storage arrays to zero, to get ready for new data. This is a very important step since the user could have either deleted all the objects on the chart before initializing the EA again.
   if (ObjectsTotal(0,0,OBJ_RECTANGLE)==0){
      Print("No FVGs Found, Resizing storage arrays to 0 now!!!");
      ArrayResize(totalFVGs,0);
      ArrayResize(barINDICES,0);
      ArrayResize(signalFVGs,0);
   }
To avoid overlap of objects, we again get rid of all prior FVG setups and create new ones based on the current applied chart environment properties. This is achieved by using the prefix of our FVG setups, which makes sure that we only delete FVG rectangle objects created by our EA, so it can be compatible with other EAs.
ObjectsDeleteAll(0,FVG_Prefix);
We then will loop via all the visible bars on the chart, get the bar properties, and then check for fulfilment of being a valid FVG setup.
Here is a step-by-step description:
To search for a bullish FVG setup, we get the low of the first bar, at index i, technically this is our bar number 0 if we were to assume we already have a setup of only 3 bars, get high of the third bar, at index i+2, and get their gap difference in points form.
      double low0 = iLow(_Symbol,_Period,i);
      double high2 = iHigh(_Symbol,_Period,i+2);
      double gap_L0_H2 = NormalizeDouble((low0 - high2)/_Point,_Digits);
The same logic applies when searching for bearish setups. To search for a bearish FVG setup, we get the high of the first bar, at index i, technically this is our bar number 0 if we were to assume we already have a setup of only 3 bars, get low of the third bar, at index i+2, and get their gap difference in points form.
      double high0 = iHigh(_Symbol,_Period,i);
      double low2 = iLow(_Symbol,_Period,i+2);
      double gap_H0_L2 = NormalizeDouble((low2 - high0)/_Point,_Digits);
After getting the points difference, we can now use the returned values to check if there's an existence of any of the FVG setups. To achieve this, we use two boolean variables:
-
FVG_UP - Checks that low of bar index i is greater than high of bar index i+2, and at the same time, the computed gap points is greater than minimum allowed rectangle points.
-
FVG_DOWN - Checks that high of bar index i is less than low of bar index i+2, and at the same time, the computed gap points is greater than minimum allowed rectangle points.
Apparently, the check for minimum points ensures that we have only valid and meaningful FVG setups, caused by possible spontaneous price movements, and does not trash our chart.
      bool FVG_UP = low0 > high2 && gap_L0_H2 > minPts;
      bool FVG_DOWN = low2 > high0 && gap_H0_L2 > minPts;
Once we have a confirmed FVG setup, any, we then proceed to create the respective FVG setup, along with its data documentation in the storage arrays.
We define time1 variable of data type datetime, where we store time for the central bar, which is the middle or second bar, at index i+1, where the rectangle will begin.
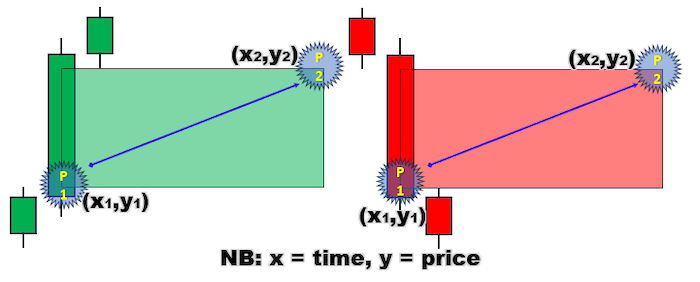
Again, we define price1 variable of data type double, where we use ternary operator to return high of the third bar in the case of a bullish FVG setup, else high of the first bar in the case of a bearish FVG setup.
Technically, this serves as the coordinates of the first point of our rectangle object to be drawn.
         datetime time1 = iTime(_Symbol,_Period,i+1);
         double price1 = FVG_UP ? high2 : high0;
After defining the first coordinates, we then define the second coordinates.
We define time2 variable of data type datetime, where we store time for the end bar, which is the bar at which the drawn rectangle ends. This is achieved by simply adding to time1, the starting time, the number of bars to extend the rectangle.
Again, we define price2 variable of data type double, where we use ternary operator to return low of the first bar in the case of a bullish FVG setup, else low of the third bar in the case of a bearish FVG setup.
         datetime time2 = time1 + PeriodSeconds(_Period)*FVG_Rec_Ext_Bars;
         double price2 = FVG_UP ? low0 : low2;
Below is a viasualization of the coordinates needed to ensure smooth creation of the rectangles.
After getting the coordinates of the FVG setup, we then need to give a name to that FVG rectangle object.
We use the predefined prefix as the prefix of our FVG, and add the time of creation to it. This ensures, firstly, that once we create an FVG object at that bar time, we cannot create it again since at that particular candle time, an object of a similar title already exists, and secondly, there is uniqueness since for sure there cannot be any other similar bar time.
string fvgNAME = FVG_Prefix+"("+TimeToString(time1)+")";
We also need to assign different colors to our FVG setups so that we can distinguish between bullish and bearish setups. Bullish setups are assigned the predefined bullish color, i.e. CLR_UP, and bearish setups the predefined bearish color, i.e. CLR_DOWN.
color fvgClr = FVG_UP ? CLR_UP : CLR_DOWN; Up to this extent, we have everything that we need to draw the respective FVG setup in the chart.
To easily do this, we proceed and create a void function on the global scope. We define the function as CreateRec, and pass in the object name, coordinates to point one and point two respectively, and color, variables that are needed in the creation of the FVG setups.
void CreateRec(string objName,datetime time1,double price1,
               datetime time2, double price2,color clr){
   if (ObjectFind(0,objName) < 0){
      ObjectCreate(0,objName,OBJ_RECTANGLE,0,time1,price1,time2,price2);

      ObjectSetInteger(0,objName,OBJPROP_TIME,0,time1);
      ObjectSetDouble(0,objName,OBJPROP_PRICE,0,price1);
      ObjectSetInteger(0,objName,OBJPROP_TIME,1,time2);
      ObjectSetDouble(0,objName,OBJPROP_PRICE,1,price2);
      ObjectSetInteger(0,objName,OBJPROP_COLOR,clr);
      ObjectSetInteger(0,objName,OBJPROP_FILL,true);
      ObjectSetInteger(0,objName,OBJPROP_BACK,false);

      ChartRedraw(0);
   }
}
Use the created function afterwards to create the respective FVG rectangle on the chart, passing in the precrafted parameters.
CreateRec(fvgNAME,time1,price1,time2,price2,fvgClr);
After creating the FVG setup, we need to store the data to the storage arrays. But since we did create dynamic arrays, we first of all resize them to incorporate an extra data value, by using ArrayResize function.
         ArrayResize(totalFVGs,ArraySize(totalFVGs)+1);
         ArrayResize(barINDICES,ArraySize(barINDICES)+1);
Upon resizing the data storage arrays, we then go ahead and add the new data to the array respectively.
         totalFVGs[ArraySize(totalFVGs)-1] = fvgNAME;
         barINDICES[ArraySize(barINDICES)-1] = i+1;
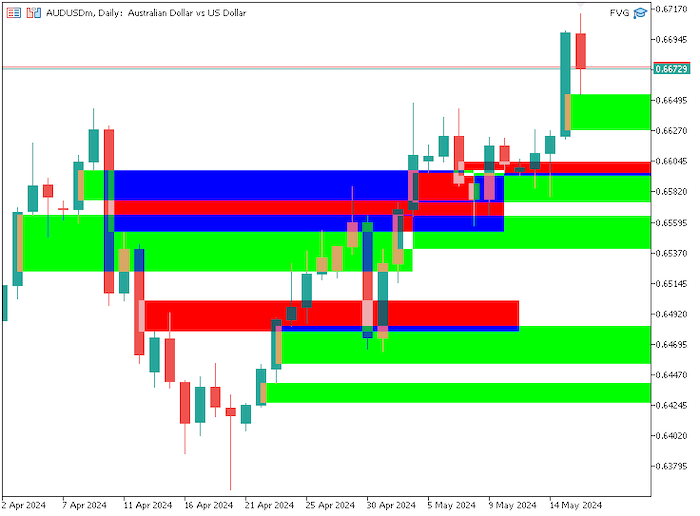
Up to this point, we have successfully succeeded in creating FVG setups for all the visible bars on the chart. Below is the milestone result.
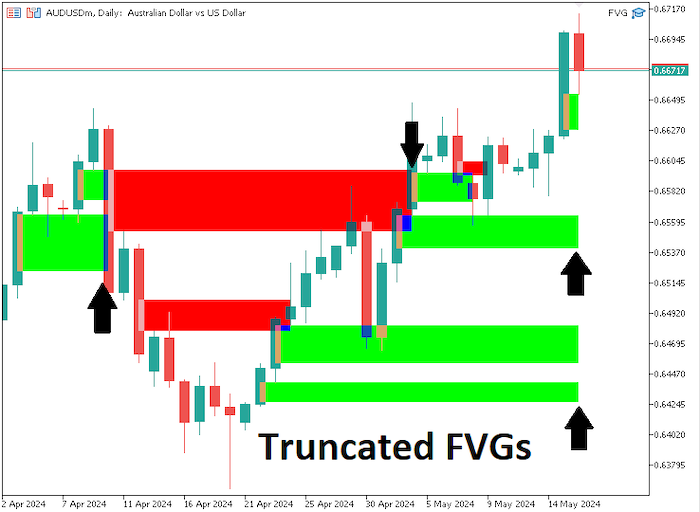
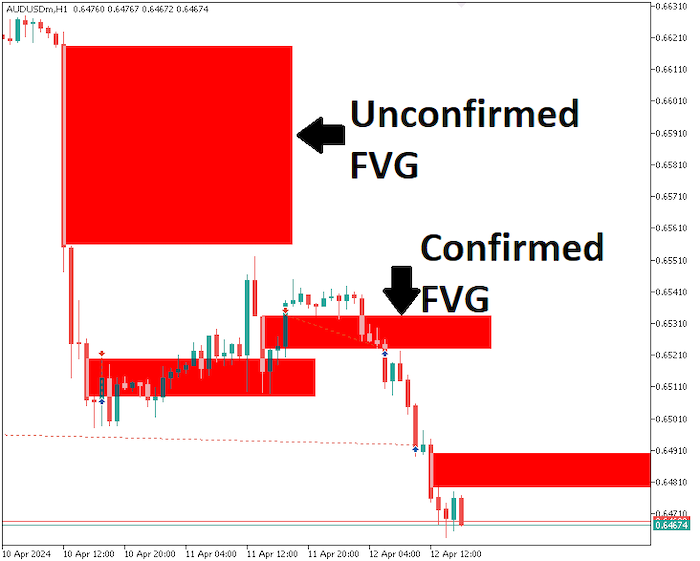
The user could be needing that the setups that could have been confirmed be cut short once confirmed, as a way of saying there was an already successful FVG setup. So we need to truncate extra length of the setups once price confirms them. We achieve this by looping via all the total created and confirmed FVG setups, getting the respective details, checking the datails against the control logic, and finally updating the setups respectively.
Here is a step-by-step procedure on how that is achieved:
Loop via all the created FVG setups using the for loop function.
for (int i=ArraySize(totalFVGs)-1; i>=0; i--){// ... }
Get/retrieve the setup data.
      string objName = totalFVGs[i];
      string fvgNAME = ObjectGetString(0,objName,OBJPROP_NAME);
      int barIndex = barINDICES[i];
      datetime timeSTART = (datetime)ObjectGetInteger(0,fvgNAME,OBJPROP_TIME,0);
      datetime timeEND = (datetime)ObjectGetInteger(0,fvgNAME,OBJPROP_TIME,1);
      double fvgLOW = ObjectGetDouble(0,fvgNAME,OBJPROP_PRICE,0);
      double fvgHIGH = ObjectGetDouble(0,fvgNAME,OBJPROP_PRICE,1);
      color fvgColor = (color)ObjectGetInteger(0,fvgNAME,OBJPROP_COLOR);
Loop via all the rectangle extension bars, i.e. the length of the selected rectangle.
for (int k=barIndex-1; k>=(barIndex-FVG_Rec_Ext_Bars); k--){//... }
Get the bar data.
         datetime barTime = iTime(_Symbol,_Period,k);
         double barLow = iLow(_Symbol,_Period,k);
         double barHigh = iHigh(_Symbol,_Period,k);
In the case where the rectangle extends beyond the the first visible bar in a time series, simply truncate it to the first bar's time, i.e. the bar at index 0, or simply put, the current bar. Inform of the overflow detection, update the FVG setup to the current bar's time, and break the operation loop.
         if (k==0){
            Print("OverFlow Detected @ fvg ",fvgNAME);
            UpdateRec(fvgNAME,timeSTART,fvgLOW,barTime,fvgHIGH);
            break;
         }
To easily update the setups, we create a void function by the name UpdateRec, passing in the object name, and coordinates of the two vital points of the rectangle object to be updated.
void UpdateRec(string objName,datetime time1,double price1,
               datetime time2, double price2){
   if (ObjectFind(0,objName) >= 0){
      ObjectSetInteger(0,objName,OBJPROP_TIME,0,time1);
      ObjectSetDouble(0,objName,OBJPROP_PRICE,0,price1);
      ObjectSetInteger(0,objName,OBJPROP_TIME,1,time2);
      ObjectSetDouble(0,objName,OBJPROP_PRICE,1,price2);

      ChartRedraw(0);
   }
}
In the case where the FVG setup is a bearish FVG, detected by the color, and the high price of the selected bar is above the upper coordinates of the FVG object, it signals that the FVG was a success and thus truncates it accordingly, i.e. updates the second point coordinates to the candle where the break of the FVG occurs. Likewise, a bullish FVG setup holds true.
         if ((fvgColor == CLR_DOWN && barHigh > fvgHIGH) ||
            (fvgColor == CLR_UP && barLow < fvgLOW)
         ){
            Print("Cut Off @ bar no: ",k," of Time: ",barTime);
            UpdateRec(fvgNAME,timeSTART,fvgLOW,barTime,fvgHIGH);
            break;
         }
Once everything is all set, we resize the storage arrays to zero, to get ready for the OnTick section.
   ArrayResize(totalFVGs,0);
   ArrayResize(barINDICES,0);
The full OnInit code responsible for creating FVG setups on the visible bars on the chart and updating them accordingly will be as follows:
//+------------------------------------------------------------------+
//| Expert initialization function                                   |
//+------------------------------------------------------------------+
int OnInit(){

   int visibleBars = (int)ChartGetInteger(0,CHART_VISIBLE_BARS);
   Print("Total visible bars on chart = ",visibleBars);

   if (ObjectsTotal(0,0,OBJ_RECTANGLE)==0){
      Print("No FVGs Found, Resizing storage arrays to 0 now!!!");
      ArrayResize(totalFVGs,0);
      ArrayResize(barINDICES,0);
      ArrayResize(signalFVGs,0);
   }

   ObjectsDeleteAll(0,FVG_Prefix);

   for (int i=0; i<=visibleBars; i++){
      //Print("Bar Index = ",i);
      double low0 = iLow(_Symbol,_Period,i);
      double high2 = iHigh(_Symbol,_Period,i+2);
      double gap_L0_H2 = NormalizeDouble((low0 - high2)/_Point,_Digits);

      double high0 = iHigh(_Symbol,_Period,i);
      double low2 = iLow(_Symbol,_Period,i+2);
      double gap_H0_L2 = NormalizeDouble((low2 - high0)/_Point,_Digits);

      bool FVG_UP = low0 > high2 && gap_L0_H2 > minPts;
      bool FVG_DOWN = low2 > high0 && gap_H0_L2 > minPts;

      if (FVG_UP || FVG_DOWN){
         Print("Bar Index with FVG = ",i+1);
         datetime time1 = iTime(_Symbol,_Period,i+1);
         double price1 = FVG_UP ? high2 : high0;
         datetime time2 = time1 + PeriodSeconds(_Period)*FVG_Rec_Ext_Bars;
         double price2 = FVG_UP ? low0 : low2;
         string fvgNAME = FVG_Prefix+"("+TimeToString(time1)+")";
         color fvgClr = FVG_UP ? CLR_UP : CLR_DOWN;
         CreateRec(fvgNAME,time1,price1,time2,price2,fvgClr);
         Print("Old ArraySize = ",ArraySize(totalFVGs));
         ArrayResize(totalFVGs,ArraySize(totalFVGs)+1);
         ArrayResize(barINDICES,ArraySize(barINDICES)+1);
         Print("New ArraySize = ",ArraySize(totalFVGs));
         totalFVGs[ArraySize(totalFVGs)-1] = fvgNAME;
         barINDICES[ArraySize(barINDICES)-1] = i+1;
         ArrayPrint(totalFVGs);
         ArrayPrint(barINDICES);
      }
   }

   for (int i=ArraySize(totalFVGs)-1; i>=0; i--){
      string objName = totalFVGs[i];
      string fvgNAME = ObjectGetString(0,objName,OBJPROP_NAME);
      int barIndex = barINDICES[i];
      datetime timeSTART = (datetime)ObjectGetInteger(0,fvgNAME,OBJPROP_TIME,0);
      datetime timeEND = (datetime)ObjectGetInteger(0,fvgNAME,OBJPROP_TIME,1);
      double fvgLOW = ObjectGetDouble(0,fvgNAME,OBJPROP_PRICE,0);
      double fvgHIGH = ObjectGetDouble(0,fvgNAME,OBJPROP_PRICE,1);
      color fvgColor = (color)ObjectGetInteger(0,fvgNAME,OBJPROP_COLOR);

      Print("FVG NAME = ",fvgNAME," >No: ",barIndex," TS: ",timeSTART," TE: ",
            timeEND," LOW: ",fvgLOW," HIGH: ",fvgHIGH," CLR = ",fvgColor);
      for (int k=barIndex-1; k>=(barIndex-FVG_Rec_Ext_Bars); k--){
         datetime barTime = iTime(_Symbol,_Period,k);
         double barLow = iLow(_Symbol,_Period,k);
         double barHigh = iHigh(_Symbol,_Period,k);
         //Print("Bar No: ",k," >Time: ",barTime," >H: ",barHigh," >L: ",barLow);

         if (k==0){
            Print("OverFlow Detected @ fvg ",fvgNAME);
            UpdateRec(fvgNAME,timeSTART,fvgLOW,barTime,fvgHIGH);
            break;
         }

         if ((fvgColor == CLR_DOWN && barHigh > fvgHIGH) ||
            (fvgColor == CLR_UP && barLow < fvgLOW)
         ){
            Print("Cut Off @ bar no: ",k," of Time: ",barTime);
            UpdateRec(fvgNAME,timeSTART,fvgLOW,barTime,fvgHIGH);
            break;
         }
      }

   }

   ArrayResize(totalFVGs,0);
   ArrayResize(barINDICES,0);

   return(INIT_SUCCEEDED);
}
On the OnTick section, similar functions and logic are used. We loop via all the predefined prior extension bars, or rather the length of the FVG setup from the current bar, search for potential setups, and create if any is found and confirmed.
Here are the slight differences in the creation loop used.
On the OnInit FVG setup creation loop, we consider all the visible bars on the chart. Here, on the contrary, we just consider the last predefined extension length.
for (int i=0; i<=FVG_Rec_Ext_Bars; i++){//... }
When getting information for the bars, we start at the bar prior to the current bar index, since the bar is still in the formation process. So we add 1 to the selected index.
      double low0 = iLow(_Symbol,_Period,i+1);
      double high2 = iHigh(_Symbol,_Period,i+2+1);
On the OnInit FVG truncation loop, we truncate the confirmed and tested FVG setups. On the OnTick section, we do not truncate the setups because we want to view them. We instead send instant market orders respectively. Again, once the price is beyond the bar length, it means that we cannot trade that setup whatsoever, and so we get rid of the the stored data in the arrays. Here are the code differences:
We add a new boolean variable fvgExist and initialize it to false, so it can hold the flags on the availability of a setup within the scanned bars.
bool fvgExist = false;
We again loop via the predefined bars starting from the bar prior to the current bar, i.e. 0 + 1 = 1, getting the high and low prices of the selected bar, and if any of the prices matches the coordinates of the second point of the setup, it is still within the range, hence can still be traded, and thus we set the fvgExist variable to true.
      for (int k=1; k<=FVG_Rec_Ext_Bars; k++){
         double barLow = iLow(_Symbol,_Period,k);
         double barHigh = iHigh(_Symbol,_Period,k);

         if (barHigh == fvgLow || barLow == fvgLow){
            //Print("Found: ",fvgNAME," @ bar ",k);
            fvgExist = true;
            break;
         }
      }
Since we want to infiltrate the market, and this will require the entry price levels, we define the current symbol quotes early.
      double Ask = NormalizeDouble(SymbolInfoDouble(_Symbol,SYMBOL_ASK),_Digits);
      double Bid = NormalizeDouble(SymbolInfoDouble(_Symbol,SYMBOL_BID),_Digits);
Use if statements afterwards to check if the selected FVG setup is a bearish setup and that the current Bid price is above the upper coordinates of the setup and at the same time, this is the first trade signal for the setup, and when all of the conditions are passed, open a sell order, with the trade volume of 0.01. The open price is the current market Bid price, with takeprofit level at the lower coordinates of the FVG setup, and stoploss at a risk to reward of 1:10, above the entry price. Once the position is initiated, we set the signal data at that particular index to true, so that we do not open any other position based on that particular setup on the next tick.
      if (fvgColor == CLR_DOWN && Bid > fvgHigh && !signalFVGs[j]){
         Print("SELL SIGNAL For (",fvgNAME,") Now @ ",Bid);
         double SL_sell = Ask + NormalizeDouble((((fvgHigh-fvgLow)/_Point)*10)*_Point,_Digits);
         double trade_lots = Check1_ValidateVolume_Lots(0.01);

         if (Check2_Margin(ORDER_TYPE_SELL,trade_lots) &&
             Check3_VolumeLimit(trade_lots) &&
             Check4_TradeLevels(POSITION_TYPE_SELL,SL_sell,fvgLow)){
            obj_Trade.Sell(trade_lots,_Symbol,Bid,SL_sell,fvgLow);
            signalFVGs[j] = true;
         }
         ArrayPrint(totalFVGs,_Digits," [< >] ");
         ArrayPrint(signalFVGs,_Digits," [< >] ");
      }
Likewise, a bullish confirmation holds true, but opposite conditions prevail.
      else if (fvgColor == CLR_UP && Ask < fvgLow && !signalFVGs[j]){
         Print("BUY SIGNAL For (",fvgNAME,") Now @ ",Ask);
         double SL_buy = Bid - NormalizeDouble((((fvgHigh-fvgLow)/_Point)*10)*_Point,_Digits);
         double trade_lots = Check1_ValidateVolume_Lots(0.01);

         if (Check2_Margin(ORDER_TYPE_BUY,trade_lots) &&
             Check3_VolumeLimit(trade_lots) &&
             Check4_TradeLevels(POSITION_TYPE_BUY,SL_buy,fvgHigh)){
            obj_Trade.Buy(trade_lots,_Symbol,Ask,SL_buy,fvgHigh);
            signalFVGs[j] = true;
         }
         ArrayPrint(totalFVGs,_Digits," [< >] ");
         ArrayPrint(signalFVGs,_Digits," [< >] ");
      }
Finally, once the FVG setup is out of existence, it means that we can nolonger trade it, and thus our least concern. So we free the storage arrays by getting rid of the corresponding data. This is achieved using the ArrayRemove function, passing in the array, the starting position, in this case 0 for the first data, and total elements, in this case 1, since we only want to remove the data for that single and currently selected FVG setup.
      if (fvgExist == false){
         bool removeName = ArrayRemove(totalFVGs,0,1);
         bool removeTime = ArrayRemove(barTIMEs,0,1);
         bool removeSignal = ArrayRemove(signalFVGs,0,1);
         if (removeName && removeTime && removeSignal){
            Print("Success removing the FVG DATA from the arrays. New Data as Below:");
            Print("FVGs: ",ArraySize(totalFVGs)," TIMEs: ",ArraySize(barTIMEs),
                     " SIGNALs: ",ArraySize(signalFVGs));
            ArrayPrint(totalFVGs);
            ArrayPrint(barTIMEs);
            ArrayPrint(signalFVGs);
         }
      }
The following is the OnTick code needed to create the FVG setups, trade the confirmed setups, and remove data of those off-limits from the storage arrays:
//+------------------------------------------------------------------+
//| Expert tick function                                             |
//+------------------------------------------------------------------+
void OnTick(){

   for (int i=0; i<=FVG_Rec_Ext_Bars; i++){
      double low0 = iLow(_Symbol,_Period,i+1);
      double high2 = iHigh(_Symbol,_Period,i+2+1);
      double gap_L0_H2 = NormalizeDouble((low0 - high2)/_Point,_Digits);

      double high0 = iHigh(_Symbol,_Period,i+1);
      double low2 = iLow(_Symbol,_Period,i+2+1);
      double gap_H0_L2 = NormalizeDouble((low2 - high0)/_Point,_Digits);

      bool FVG_UP = low0 > high2 && gap_L0_H2 > minPts;
      bool FVG_DOWN = low2 > high0 && gap_H0_L2 > minPts;

      if (FVG_UP || FVG_DOWN){
         datetime time1 = iTime(_Symbol,_Period,i+1+1);
         double price1 = FVG_UP ? high2 : high0;
         datetime time2 = time1 + PeriodSeconds(_Period)*FVG_Rec_Ext_Bars;
         double price2 = FVG_UP ? low0 : low2;
         string fvgNAME = FVG_Prefix+"("+TimeToString(time1)+")";
         color fvgClr = FVG_UP ? CLR_UP : CLR_DOWN;

         if (ObjectFind(0,fvgNAME) < 0){
            CreateRec(fvgNAME,time1,price1,time2,price2,fvgClr);
            Print("Old ArraySize = ",ArraySize(totalFVGs));
            ArrayResize(totalFVGs,ArraySize(totalFVGs)+1);
            ArrayResize(barTIMEs,ArraySize(barTIMEs)+1);
            ArrayResize(signalFVGs,ArraySize(signalFVGs)+1);
            Print("New ArraySize = ",ArraySize(totalFVGs));
            totalFVGs[ArraySize(totalFVGs)-1] = fvgNAME;
            barTIMEs[ArraySize(barTIMEs)-1] = time1;
            signalFVGs[ArraySize(signalFVGs)-1] = false;
            ArrayPrint(totalFVGs);
            ArrayPrint(barTIMEs);
            ArrayPrint(signalFVGs);
         }
      }
   }

   for (int j=ArraySize(totalFVGs)-1; j>=0; j--){
      bool fvgExist = false;
      string objName = totalFVGs[j];
      string fvgNAME = ObjectGetString(0,objName,OBJPROP_NAME);
      double fvgLow = ObjectGetDouble(0,fvgNAME,OBJPROP_PRICE,0);
      double fvgHigh = ObjectGetDouble(0,fvgNAME,OBJPROP_PRICE,1);
      color fvgColor = (color)ObjectGetInteger(0,fvgNAME,OBJPROP_COLOR);

      for (int k=1; k<=FVG_Rec_Ext_Bars; k++){
         double barLow = iLow(_Symbol,_Period,k);
         double barHigh = iHigh(_Symbol,_Period,k);

         if (barHigh == fvgLow || barLow == fvgLow){
            //Print("Found: ",fvgNAME," @ bar ",k);
            fvgExist = true;
            break;
         }
      }

      //Print("Existence of ",fvgNAME," = ",fvgExist);

      double Ask = NormalizeDouble(SymbolInfoDouble(_Symbol,SYMBOL_ASK),_Digits);
      double Bid = NormalizeDouble(SymbolInfoDouble(_Symbol,SYMBOL_BID),_Digits);

      if (fvgColor == CLR_DOWN && Bid > fvgHigh && !signalFVGs[j]){
         Print("SELL SIGNAL For (",fvgNAME,") Now @ ",Bid);
         double SL_sell = Ask + NormalizeDouble((((fvgHigh-fvgLow)/_Point)*10)*_Point,_Digits);
         double trade_lots = Check1_ValidateVolume_Lots(0.01);

         if (Check2_Margin(ORDER_TYPE_SELL,trade_lots) &&
             Check3_VolumeLimit(trade_lots) &&
             Check4_TradeLevels(POSITION_TYPE_SELL,SL_sell,fvgLow)){
            obj_Trade.Sell(trade_lots,_Symbol,Bid,SL_sell,fvgLow);
            signalFVGs[j] = true;
         }
         ArrayPrint(totalFVGs,_Digits," [< >] ");
         ArrayPrint(signalFVGs,_Digits," [< >] ");
      }
      else if (fvgColor == CLR_UP && Ask < fvgLow && !signalFVGs[j]){
         Print("BUY SIGNAL For (",fvgNAME,") Now @ ",Ask);
         double SL_buy = Bid - NormalizeDouble((((fvgHigh-fvgLow)/_Point)*10)*_Point,_Digits);
         double trade_lots = Check1_ValidateVolume_Lots(0.01);

         if (Check2_Margin(ORDER_TYPE_BUY,trade_lots) &&
             Check3_VolumeLimit(trade_lots) &&
             Check4_TradeLevels(POSITION_TYPE_BUY,SL_buy,fvgHigh)){
            obj_Trade.Buy(trade_lots,_Symbol,Ask,SL_buy,fvgHigh);
            signalFVGs[j] = true;
         }
         ArrayPrint(totalFVGs,_Digits," [< >] ");
         ArrayPrint(signalFVGs,_Digits," [< >] ");
      }

      if (fvgExist == false){
         bool removeName = ArrayRemove(totalFVGs,0,1);
         bool removeTime = ArrayRemove(barTIMEs,0,1);
         bool removeSignal = ArrayRemove(signalFVGs,0,1);
         if (removeName && removeTime && removeSignal){
            Print("Success removing the FVG DATA from the arrays. New Data as Below:");
            Print("FVGs: ",ArraySize(totalFVGs)," TIMEs: ",ArraySize(barTIMEs),
                     " SIGNALs: ",ArraySize(signalFVGs));
            ArrayPrint(totalFVGs);
            ArrayPrint(barTIMEs);
            ArrayPrint(signalFVGs);
         }
      }
   }

}
Cheers to us! Now we did create a smart money concept trading system based on FVG/Imbalance strategy to generate trading signals.
Fair Value Gap (FVG) strategy tester results
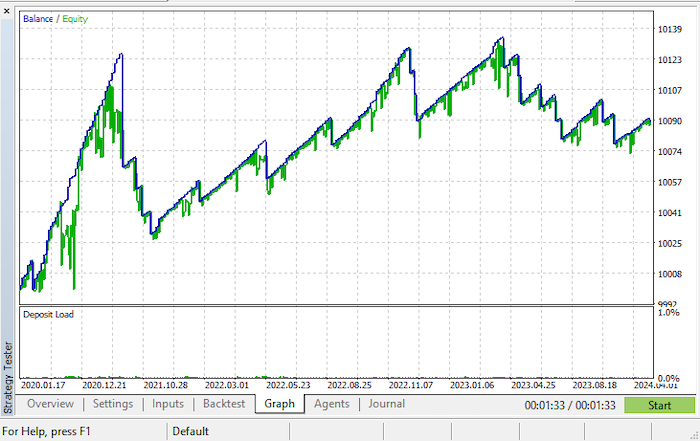
Upon testing on the strategy tester, here are the results.
- Balance/Equity graph:
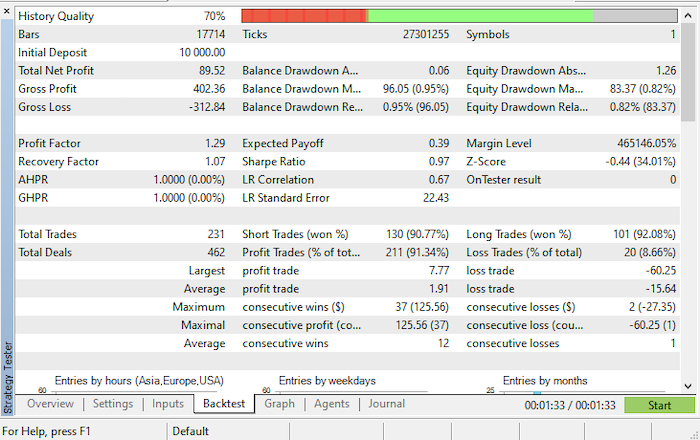
- Backtest results:
Conclusion
In conclusion, the exploration of coding the fair value gap or imbalance strategy through the various topics as described provides valuable insights into quantitative trading methodologies. Through this article, we have delved into the intricate details of implementing such strategies, touching upon key components including data analysis, statistical modeling, and algorithmic trading techniques.
Firstly, understanding the concept of a fair value gap or imbalance is essential, as it forms the foundation of the strategy. It involves identifying discrepancies between the market price of an asset and its intrinsic value and utilizing statistical methods to gauge these differences accurately.
Moreover, the article emphasizes the significance of robust data analysis techniques for extracting meaningful insights from financial data. Techniques such as time series analysis, candlestick analysis, and sentiment analysis play a crucial role in identifying patterns and trends that can inform trading decisions.
Furthermore, the coding aspect of the strategy highlights the importance of proficiency in the MQL5 programming language as well as familiarity with MQL5 libraries and functions. Efficient coding practices enable the automation of trading processes, facilitating faster execution and the scalability of the strategy.
Disclaimer: The information illustrated in this article is only for educational purposes. It is just intended to show insights on how to create a fair value gap EA based on the Smart Money Concept approach and thus should be used as a base for creating a better expert advisor with more optimization and data extraction taken into account. The information presented does not guarantee any trading results.
Overall, the article underscores the interdisciplinary nature of quantitative trading, statistics, and bar analysis to develop effective strategies for navigating dynamic financial markets. By synthesizing theoretical concepts with practical coding implementations, the article equips readers with the necessary tools to pursue quantitative trading endeavors successfully, specifically the Smart Money Concept (SMC) approach.
- Free trading apps
- Over 8,000 signals for copying
- Economic news for exploring financial markets
You agree to website policy and terms of use
Thanks for the Insight, very illustrative
Thank you @Anidenice for your polite feedback. We're very glad.
Thanks a lot for this insightful revelation of knowledge Allan. I've been following you on YouTube for months. You're blessed.
Thank you too @Mark Hezekiah for your feedback. Welcome. We are glad you are always with us. Be blessed.
Thank you too @Mark Hezekiah for your feedback. Welcome. We are glad you are always with us. Be blessed.
Please do well to accept my friend request.
@Mark Hezekiah Okay.