Watch the Market tutorial videos on YouTube
How to buy а trading robot or an indicator
Run your EA on
virtual hosting
virtual hosting
Test аn indicator/trading robot before buying
Want to earn in the Market?
How to present a product for a sell-through
Expert Advisors and Indicators for MetaTrader 5 - 51

This indicator has the main purpose of showing the current spread of the asset in which the indicator was placed. Depending on the photos, visually and within the graph itself, it is possible to view the spread value at the current time, it is possible to change the vertical position of the text and the horizontal position, in addition to the font size and color of the text.
FREE

Imagine what results you could achieve in your manual trading if you had a tool that notifies you of a possible price reversal for all the symbols you are interested in at the same time (futures, stocks, forex or cryptocurrency)?
VSA screener is just the right tool. It was created for traders who value their time and make their own trading decisions on opening or closing a position. The software monitors the presence of trading patterns on the preselected tickers under several timeframes (up t
FREE

This indicator is based on the MACD indicator
Also, some candlestick patterns are used in it to identify better signals
Can be used in all symbols
Can be used in all time frames
Easy to use method
Adequate settings
Settings: period: The number of candles used to calculate signals. pFast: Like the MACD indicator settings pSlow: Like the MACD indicator settings
alarmShow: If you want to receive an alert in Metatrader after receiving the signal, enable this setting alarmShowNoti: If you
FREE

Are You Tired Of Getting Hunted By Spikes And Whipsaws?
Don't become a victim of the market's erratic moves.. Do Something About It!
Instantly make smarter decisions with Impulse Pro's precise balance of filters and accurate statistics.
Timing Is Everything In Trading
To learn more, please visit www.mql5.com/en/blogs/post/718212 Anticipate the next big move before it unfolds in 3 Simple Steps!
Advantages You Get
Early impulse detection algorithm.
Flexible combination to different tr

This EA allows you to secure a position by closing a percentage of the position and changing the stop loss once the price reaches the trigger. Please leave a comment. Thank you !!! Settings : percentage : the lots percentage to close at breakeven buffer : the distance between the entry price and the new sl trigger : distance in points to activate the breakeven Lots : the volume you use to open the position. (Very important: it must be the same lot as the position)
FREE

It is the simplest indicator in existence. It has only one function: report the seconds elapsed since the last minute end in a very convenient way, with a label that can be moved in the chart, so that the trader does not have to take his eye off the forming candle. It is used on M1, but also on larger intervals, for those interested in opening/closing positions at the best time. Sometimes an intense movement in the last 10" of the minute gives indications of future trend, and can be used for sc
FREE
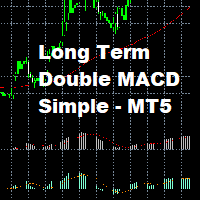
Long Term Double MACD Strategy with EMA Trend Confirmation
This strategy uses a leading and lagging MACD indicator. The leading indicator gives the entry signals, and the lagging indicator gives the exit signals. This Expert does not use any account management and as such you should make sure to set good stop losses.
Works best on longer timeframes on low volatility pairs.
FREE

Trade Panel MetaTrader 5 - feature-rich tool that adds the desired and highly-demanded functions to the terminal to enhance trading experience. Orders execution with one click You can open and close orders easily, using the panel. Buttons to open Market, Limit and Stop orders in both buy and sell directions are located on the Main tab, while there are multiple options to close already existing positions and cancel orders: Close/cancel all Close/cancel buy and sell positions/orders separately Clo

Introducing "Congestion Breakout MT5" - the indicator that helps you identify congestion zones in your chart and alerts you when the price breaks through them. Traders know that congestion zones can be key areas of price action and can indicate potential turning points in the market. However, spotting these zones and anticipating breakouts can be a difficult and time-consuming task. That's where "Congestion Breakout" comes in. This powerful indicator uses advanced algorithms to analyze the pri

Introduction to the Magic TD Sequential 9
The "Magic TD 9" is a technical analysis tool for stocks. It is based on historical price data and divides prices into nine levels based on a certain magnitude. It then calculates the average price of each level and constructs a sequence of nine data points. This sequence is called the "Magic TD 9," with the first data point representing the stock's lowest price and the ninth data point representing the highest price.
Index inputs:
1 Turns: repr
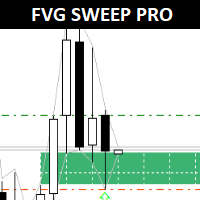
FVG Sweep Pro is a trading system designed for the MetaTrader 5 platform. This EA is built on my Fair Value Gap Sweep indicator(the principle of sweeping fair value gaps). It executes trades under specific conditions such as time of day, gap size and other criteria fully customizable by the user.
For optimal operation, it is recommended to use these pairs with low spreads.
One of the key features of FVG Sweep Pro is its risk management system. Users can specify their desired risk percent pe
Introducing the Chart Walker Analysis Engine: Your Pathway to Market Success. by Chart Walker Powerful MT5 chart analysis engine equipped with a sophisticated neural network algorithm. This cutting-edge technology enables traders to perform comprehensive chart analysis effortlessly on any financial chart. With its advanced capabilities, Chart Walker streamlines the trading process by providing highly accurate trading entries based on the neural network's insights. Its high-speed calculations ens

Готовый автоматический советник, торгует на классических индикаторах. Создан специально для EURJPY Таймфрейм Д1 .
Суть стратегии - отрабатываются месячные уровни инструмента EURJPY . Используются классические стоп-лоссы, тейк-профиты и трейлинг-стоп. Рекомендуется закрытие сделок в пятницу в 21-00 ( ExitOnFriday = true) Настройки советника: MagicNumber = 100 ; //MagicNumber тактики 1 MagicNumber2 = 11111; //MagicNumber2 тактики 2 magic3 = 123 ; //magic3 тактики 3 mag
FREE
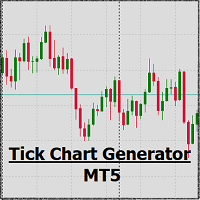
EA create custom Tick bar charts and provide real-time updates for MT5. This is an MT4 "offline" chart equivalent which is very simple to use. Generated Tick bar Chart compatible to MT5 indicator or template and perform your technical analysis with Multi timeframe analysis. The generator uses tick data to plot the historical tick chart for a particular setting and live ticks for plotting live charts. This method of calculation gives very accurate charts as no approximation is used. This EA creat

Welcome! We are delighted to introduce our latest expert, which is a semi-automatic trading system that includes all the features you need for position management. Simply draw a line on a significant trend or supply-demand level, and the expert will take care of the rest for you. It comes with a wide range of risk management and position management tools, such as trailing stop, partial closure, break even, determination of stop loss and take profit levels using ATR, as well as automatic lot siz

Contact me after payment to send you the user manual PDF file. Download the MT4 version here. Unlocking Trading Insights Dive into the heart of market dynamics with Advance Divergence Scanner designed for traders seeking a competitive edge. The Divergence Indicator is your key to identifying crucial divergences across various charts, empowering you to make informed decisions in the dynamic world of financial markets. The Divergence A Divergence signals a potential reversal point because directi

Buy and Sell Grid is an expert advisor that uses mechanical strategy to trade on any timeframe and any currency pair. BUY and SELL GRID EA lets you choose between three types of grid trading strategies whether you want to trade sideways, uptrend or downtrend market. To make things easier for our users, we developed a interactive graphical panel that shows you all relevant information about EA inputs and your account.
STRATEGY Grid strategy is pure mechanical strategy, this EA has three types

This indicator allows you to enjoy the two most popular products for analyzing request volumes and market deals at a favorable price: Actual Depth of Market Chart Actual Tick Footprint Volume Chart This product combines the power of both indicators and is provided as a single file. The functionality of Actual COMBO Depth of Market AND Tick Volume Chart is fully identical to the original indicators. You will enjoy the power of these two products combined into the single super-indicator! Below is
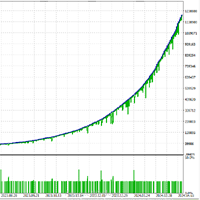
Please contact me with any questions: https://www.mql5.com/en/users/abduljalilmridah
Also add me as a friend. For more profit, please change Lots_Equity 100 to 500 / 1000 / 3000 / 5000 etc and change Risk_Percent in the input level. It's only good works on GBPUSD Daily Timeframe. This robot is profitable. Minimum deposit for default setup: $1000. You can get good results with it. You can test it first . It will increase the volume in a certain ratio as the equity increases. You don't need to

Gann 9+ Indicator Introduction The "Gann Matrix Chart" is the most simple and clear technical analysis in Gann theory, which is the calculation tool that Gann has always been committed to using. It is the essence of Gann's whole life. The Gann 9+ indicator uses the matrix chart to find the future high or low points of stocks or futures. Indicator Input: The base and step size can be set as 1 by default; When the multiple is -1, the multiple will be automatically obtained, or it can be filled in

Introducing the "Automated Stop Loss Placement" Script for MetaTrader 5 The "Automated Stop Loss Placement" script is a powerful tool designed to streamline your trading experience within the MetaTrader 5 platform. By automating the placement of stop loss orders, this script offers efficiency and convenience for traders of all levels. Key Features: Seamless Automation: Stop loss orders are placed automatically, moments after trade execution, saving you time and effort while ensuring consistent r
FREE
Automatically scans the chart to find Harmonic Patterns, and give you the chance to enter early in good operations. Also if selected, it will alert you in advance when future patterns appears, showing you a projection of a posible future pattern. The main goal for this algorithm is to determine with high precision the moment when a trend ends and a new one begins. Giving you the best price within a reversal. We have added the "Golden Trade", we define it as the perfect order: For those ord

Non-proprietary study of Joe Dinapoli used for trend analysis. The indicator gives trend signals when the fast line penetrates the slow line. These signals remain intact until another penetration occurs. The signal is confirmed at the close of the period. It is applicable for all timeframes. Inputs lnpPeriod: Period of moving average. lnpSmoothK: %K period. lnpSmoothD: %D period. ********************************************************************************
FREE

There is a very simple rule
It is Always difficult to cross high pressure areas and easy to cross low pressure areas
MT4 version is available here
This is definitely true for price
It was so simple, it was not!
So let's get started
This indicator shows you the amount of pressure in that area according to the bars that it shows. The longer the bar, the higher the pressure in that area It also marks the most pressed area with a rectangle
From now on you can simply decide on the

The MAtrio indicator displays three moving averages on any timeframe at once with a period of 50-day, 100-day, 200-day. After attaching to the chart, it immediately displays three moving averages with the parameters of simple (SMA) moving average MAmethod50 , simple (SMA) moving average MAmethod100 , simple (SMA) moving average MAmethod200 . Accordingly, with the price type MAPrice50 , MAPrice100 , MAPrice200 , by default, the price is Close price everywhere. All parameters (MA calc
FREE

The Co-Pilot is a simple trade management system designed to be the quickest way from your strategy to the market. It is optimized for single trade setups that might be short, medium or long term. The program allows you to set your trade setup directly from the chart using graphical objects, set your risk apetite and even provides oppurtunity for partial closes. It also has a built in alert system that keeps you informed on the actions taken by the copilot when youre offline.
It is designed to
FREE

Треугольным арбитражем называют одновременно открытие ордеров по трем валютным парам. Направление сделок и пары выбираются таким образом, чтобы одновременно открытые позиции страховали друг друга. За счет этого можно открываться достаточно большими лотами, и риск невелик. Варианты треугольников:
EURUSD – USDJPY – EURJPY Ордера, входящие в состав такого треугольника находятся в постоянном движении. Советник анализирует реальные цены на данный момент и просчитывает какими они должны быть. При ра
FREE

Trend indicator based on the ADX / ADXWilder indicator
The indicator shows trend areas using ADX or ADXWilder indicator data.
How the indicator works: if PDI is greater than NDI, then it`s bullish movement; if PDI is less than NDI, then it`s bearish movement; if ADX is less than or equal to the filter value specified in the parameters, then there is no movement state.
Input parameters of the indicator: Calculate Timeframe - timeframe for calculation; ADX Type - type of ADX calculation
FREE

VWAP BAR It´s power full indicator of candle by candle when lined up with greate analysis, you have great opportunity, finder defense candle. Is a good ideia from order flow method, now your meta trader 5 inside you time frame chart .
What is the Volume Weighted Average Price (VWAP)?
The volume weighted average price (VWAP) is a trading benchmark used by traders that gives the average price a security has traded at throughout the day, based on both volume and price. It is important
FREE

The Moving Average
( https://www.youtube.com/c/TheMovingAverage/ )
inspired to create All in One 4MA-s with his color setting.
It Put up 4 Smoothed Moving Averages
With Arty chosed colors.
You can modify the settings / Parameters of the indicator
It's easy to use don't have to waist time to set up all 4 MA-s
just put this up.
Hope its helpfull and Arty don't mind it.
You can donate my work here:
https://discotechnika.hu/MQL/PayPal_Donate.jpg
or here
PayPal.Me/HunSkippy
FREE

Introducing the Bollinger Band Box: A Trading Revolution! Description : The Bollinger Band Box, crafted with love by the ingenious minds at MQ4.ORG, is not your ordinary indicator. It’s like Bollinger Bands decided to ditch their old-school wavy lines and donned a sleek, futuristic exoskeleton. Let’s dive into why this little box is causing a stir among traders: Visual Clarity and Precision : Say goodbye to squinting at those zigzagging Bollinger Bands. The Bollinger Band Box wraps
FREE

The indicator is designed to close positions on the market in time. For example: to take profits ahead of schedule if the price has not reached TakeProfit, and the market is turning around. The indicator analyzes the momentum, not the trend. He does not give any information about the trend. The indicator is well suited for finding divergence. The Ershov 38 Parrots indicator dynamically adjusts to the market and detects price movement impulses of medium and high amplitude. It almost does not rea

A professional tool for trading - the divergence indicator between the OsMA and the price, which allows you to receive a signal about a trend reversal in a timely manner or catch price pullback movements (depending on the settings). The indicator settings allow you to adjust the strength of the divergence due to the angle of the OsMA peaks and the percentage change in price, which makes it possible to fine-tune the signal strength. The indicator code is optimized and is tested very quickly as
FREE

When creating, modifying and moving a trend line, two anchor points will be selected: high / low, open / close, median or weighted from the candlestick prices.
For high / low, open / close, if the anchor point is above the candlestick, the upper price will be taken, below the candlestick - the lower one. If the point is inside the candlestick, then if the first point is higher than the second, then the first one goes up, the second goes down. Conversely, if the second is higher than the first
FREE

Logarithmic chart in new window You can use both chart as half or full window All features are active in both arithmetic and logarithmic charts Magnet in arithmetic chart is standard metatrader magnet in logarithmic chart magnet have two modes: first mode only select high or low, if this mode is enabled, you can set how many candles will be search before and after to find the highest or lowest points second mode select the closest point of the candle to click, its choose between 4 points (High,
FREE

Hey guys.
This indicator will show you, in the volume histogram, if the candle was a Doji, a bullish candle, or a bearish candle.
The construction of this indicator was requested by a trader who uses other indicators from my catalog, and I decided to release it free to help traders who think that the indicator can contribute to their operations.
The parameters are:
Volume Type: Real Volume or Tick Volume. Color if the candle is bearish: select the color. Color if the candle is high:
FREE

GLX1 Renko Euro Expert Advisor (EA) can create the Renko bar charts on EURUSD or EURAUD symbols only. The Renko charts are generated as real-time custom EURUSD or EURAUD charts which can be further used for technical analysis with any MT5 compatible indicator. If you want to create Renko charts on any symbol, please use GLX1 Renko Builder Expert Advisor from here. https://www.mql5.com/en/market/product/115077
Included Features: Truly responsive Renko Charting on a custom EURUSD or E
FREE

Automatic cataloging of probabilistic strategies for Binary Options.
Including: * MHI 1, 2 and 3, "MHI potencializada", M5 variation, Five Flip, "Padrão do Milhão", "Três Vizinhos", C3 and Turn Over. * Analysis by time range, date, and days of the week. * Function that brings results from other pairs. * Analysis only following trend and / or side market. * Operation analysis filtering only entries after hit. * Alert after x number of hits, after loss in martingale, or in each new quadrant ent

DoubleMACD DoubleMACD DoubleMACD DoubleMACD DoubleMACD DoubleMACD DoubleMACD DoubleMACD DoubleMACD DoubleMACD DoubleMACD DoubleMACD DoubleMACD DoubleMACD DoubleMACD DoubleMACD DoubleMACD DoubleMACD DoubleMACD DoubleMACD DoubleMACD DoubleMACD DoubleMACD DoubleMACD DoubleMACD DoubleMACD DoubleMACD DoubleMACD DoubleMACD DoubleMACD
FREE

The True Oversold Overbought indicator provides you with ability to swiftly check whether the asset is oversold or overbought. Other than complementing your trading with True Oversold Overbought, you can use the indicator as your only trading system. It works with all forex instruments and will save you the headache of estimating when the market is due for a reversal or retracement. When the "Super Charge" feature is enabled, the areas where the price is in oversold/overbought status are ampli

================ // Average period ma_Sma, // Simple moving average ma_Ema, // Exponential moving average ma_Smma, // Smoothed MA ma_Lwma // Linear weighted MA =============== // Average method // Turn alerts on? // Alert on current bar? // Display messageas on alerts? // Play sound on alerts?
FREE

The Indicator indicator draws 2 clouds based on Donchian Channels indicator values. The upper cloud is formed by the upper lines values and the lower cloud by the lowers lines values. The indicator allows to change the Channels parameters and the clouds colors the period of the base line and the multiplier of each Donchian Channels instance. The indicator holds 5 buffer index as follow: [0] - Outer values of the upper cloud [1] - Inner values of the upper cloud [2] - Base/Center line values [3
FREE

Бинарный индикатор находит свечной паттерн "Поглощение" и рисует соответствующий сигнал для входа рынок. Имеет встроенные фильтры и панель для просчета количества успешных сделок. Демо версия является ознакомительной, в ней нет возможности изменять параметры. Полная версия . Особенности Работает для всех валютных пар и любых таймфреймов. Индикатор рассматривает комбинацию из 2-х или 3-х свечей в зависимости от настроек. Имеется возможность фильтровать сигналы путем настройки количества свеч
FREE
This Expert Advisor is applicable to plot wave charts as per the NeoWave method (Neely Extension of Wave Theory). NeoWave is a scientific, objective and revolutionary style of Elliott Wave Theory that was invented by Glenn Neely in 1990 in the “Mastering Elliott Wave” book. To start analyzing with this method, we need a particular chart called the Wave Chart or Cash Data chart . This is the first step for a good wave analysis. To draw this chart, Highs and Lows should be plotted in the order t

The VSA Smart Money indicator tracks the movement of professional traders, institutional trades and all compound man movements. The VSA Smart money Indicator reads bar by bar, being an excellent tool for those who use VSA, Wyckoff, PVA and Any other analysis that uses price and volume. There are 10 indications that you will find in your Chart: *On Demand *Climax *UT Thrust *Top Reversal bar *Stop Volume *No Supply *Spring *Reversal Bottom *Shakeout *Bag Holding Using this indicator you will be o

This is a tool to estimate your probability of bankruptcy. features. estimate a probability of bankruptcy (Nauzer J. Balsara) from your trade history usually, it is small print and never interfere with trades alert in large prints and color when it exceed the alert level you can set parameters(i.e. winning ratio) fixed and simulate freely *1: this value is for reference only and is not guaranteed to occur.
FREE

Track the historical outcome of your options operations on your favorite asset. It works for any asset in the spot market that has authorized option series on B3 (Brazilian stock exchange). Associate the robot with the asset you want to record and monitor its operation history and results. How to use the robot: 1. Enter historical data for your operations: Purchases and sales of the asset Purchases and sales of options on the asset Received dividends Cash inflows and outflows 2. Monitor the rea
FREE
Equity monitor
This is a simple means change informer. I wrote it for myself, maybe someone will need it...
1. Displays the change in funds for the day. Every day, when the terminal is first launched, it remembers the current funds and monitors changes throughout the day.
2. The first day of the month, well remembers the money and, within months, to monitor changes.
3. Well, it displays the profit of the open position.
To work, you need to create 4 global variables: gvarEqityDay ,
FREE

This script exports the economic calendar from MT5 as a .csv-file into the common directory of the terminal (...\Terminal\Common\Files). The generated file news.csv is necessary for using the news filter in back testing the Range Breakout Day Trader EA.
Input parameters: Country 1: First country from which the news will be exported Country 2: Second country from which the news will be exported
Date from: Start date from which the calendar data will be exported Date to: End date to which the
FREE

Scientific Calculator is a script designed to compute expressions of science, engineering and mathematics. General Description
The expression to calculate must obey syntax rules and precedence order, being constituted by the following elements: Integer and real numbers. Mathematical operators for addition (+), subtraction (-), multiplication (*), division (/) and exponentiation (^). Mathematical and trigonometric functions . Curved parentheses (()) to define the precedence and contai
FREE

Demo version of the Virtual SL TP Trailing product for testing all functions https://www.mql5.com/ru/market/product/75210
ВНИМАНИЕ: ТОЛЬКО ДЛЯ ДЕМО-СЧЕТОВ !!!
Make Trailing Stop, Take Profit, Breakeven, Stop Loss levels invisible to the broker!
HIDDEN MODE (STEALTH MODE) Virtual Trailing Stop (Virtual Trailing Stop) Virtual Take Profit (Virtual Take Profit) Virtual Breakeven (Virtual Breakeven) Virtual Stop Loss (Virtual Stop Loss) Виртуальный 2-уровневый Трейлинг-стоп Virtual
FREE

This indicator creates synthetic charts. It creates a candlestick chart plotting the price of one instrument measured against another, helping you to find hidden opportunities in the market crossing relationships between different instruments. [ Installation Guide | Update Guide | Troubleshooting | FAQ | All Products ] Find hidden trading opportunities Get a broader sense of the price of commodities Commodities range against each other and are easier to trade Correlated Indices can be traded ag
FREE
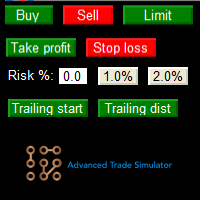
Advanced Trade Simulator for MT5
It is an indicator you can attach to any chart and then buy and sell the given symbol virtually. No actual trading takes place. You can attach it to multiple charts. Then you can buy multiple symbols.
A more detailed description here: https://www.mql5.com/en/blogs/post/750336 Features:
- buy and sell immediately on the given time frame - market , limit and stop orders - generalized OCO, more than 2 orders can cancel each other. - OSO, one sends another..

This indicator is EXCLUSIVELY to be used on the Brazilian stock exchange "B3". It automatically calculates the yesterday's Settlement Price (Ajuste) of the Symbol "DOL". It uses a mathematical calculation over the ticks received from the borker server, it DOES NOT access external sources (websites, HTTP connections, etc) so it is safe and totally reliable! For practical purposes and to maintain the longevity of the indicator it was added in the Parameters the ability to control the Time Range in
FREE

The indicator is based on the concept of price channels, which are formed by plotting the highest high and lowest low prices over a specified period of time. The Donchian Channel Indicator consists of three lines: an upper channel line, a lower channel line, and a middle channel line. The upper channel line represents the highest high over a specified period, while the lower channel line represents the lowest low. The middle channel line is the average of the two and can be used as a reference f
FREE

The VWAP Level indicator is a technical analysis tool that calculates the weighted average price for the traded volumes of a specific asset. The VWAP provides traders and investors with the average price of an asset over a specific time frame.
It is commonly used by investors to compare data on "passive" trading operations, such as pension funds and mutual funds, but also by traders who want to check if an asset has been bought or sold at a good market price.
To calculate the VWAP level we
FREE

Title : Ultimate Oscillator - Multi-Timeframe Momentum Indicator Description : Overview : The Ultimate Oscillator is a powerful and versatile technical analysis tool developed by renowned trader Larry Williams. This indicator is specially designed to capture market momentum across three different timeframes, providing a comprehensive view of the market's dynamics. Unlike traditional oscillators, which are confined to a single timeframe, the Ultimate Oscillator integrates short-term, medium-term,
FREE
Easy to use EA designed to auto trade. Works in every market condition. It uses reliable levels of MACD indicator combined with unique logic to perform fully automatic trading operations. *For MT4 version please go here! *If you don't like automated system and only need an alert system to help you in trading. Please check this arrow with alert system here!
FEATURES: Dangerous methods like martingale, hedge, grid or scalping are NOT used. Each position has Stop Loss and Take Profit. Positional
FREE

Martingale. The "Constructor Simple MT5" Expert Advisor consists of 5 separate Expert Advisors that work simultaneously and independently of each other: Bar trading. Trading with iEnvelopes indicators. Trading with the iMA indicator. Trading with the iIchimoku indicator. Trading with the iSAR indicator. The "Constructor Simple MT5" Expert Advisor is a simplified version of the "Constructor MT5" Expert Advisor. The number of input parameters is reduced to a minimum, which facilitates both the

The indicator draws a normal chart by coloring it in colors based on prices calculated by the Heiken Ashi indicator algorithm.
That is, the shape of the candles does not change.
In fact, this is the same Heiken Ashi that does not distort the price chart.
Then there will be a drawing of a cat, because there is nothing more to write about the indicator. .
FREE
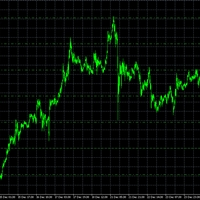
SaTo EA simple for free. 1. Double MA indicator for Entry signal 2. RSI for trend filter (Uptrend: RSI value greater than RSI level, Downtrend: RSI value less than RSI level ) 3. MACD for trend filter (Uptrend: MACD greater than signal , Downtrend: MACD less signal ) Buy signal : Fast MA greater than Slow MA, RSI value greater than RSI level, MACD greater than signal Sell signal : Fast MA less than Slow MA, RSI value less than RSI level, MACD less signal
FREE

Expert Advisor Description EA TugOfWar will open both buy and sell positions at different times according to the triggered signal, the most positions and in accordance with the market direction that will win and profit. Profit target per war is 1% to 5%. Warmode normal = Longterm strategy Warmode extreme = Shortterm strategy
Parameter Description StartTrade = Time to start trading / open position EndTrade = Time to end trading / open position WarMode = 1 -> Normal, 2 -> Extreme (lots of t
FREE

Do you want to know how an economic event will impact price? What will happen to price after the news? How has an economic news affected price in the past? This indicator can help you with that.
Do you like technical analysis? Do you enjoy studying the history to predict the future? But what do you think could be more important than technical analysis, what could improve technical analysis? Of course, it's fundamental analysis! After all, economic events directly impact the market, and theref

The Graphic Alignment Context (GAC) Technical Indicator measures the vertical difference of the simple average price of a financial instrument in the context of three different timeframes determined by a defined number of bars or candles (periods) to determine the strength of the buy or sell trend. sale. Ascending average prices indicate Buying strength (1), Descending average prices indicate Selling strength (-1) and any scenario different from the previous two conditions indicates Neutrality
FREE

This proficient advisor employs the mesmerizing dance of crossovers between a gentle, languid moving average and a nimble, swift moving average to gracefully initiate positions. In a delightful twist of intuition, it enters a tranquil purchase when the quick MA gently embraces the slow MA in a downward crossing, gracefully bidding farewell at the subsequent crossing. Conversely, a spellbinding sale is orchestrated when the swift MA elegantly crosses the slow MA, a harmonious choreography that
FREE

This is an ordinary MACD indicator displayed in the main window according to the selected chart style, i.e. Bars, Candlesticks or Line. When you switch the chart type, the indicator display also changes. Unfortunately I could not improve the chart type switching speed. After switching, there are delays before the arrival of a new tick.
The indicator parameters Fast EMA period Slow EMA period Signal SMA period Applied price
FREE
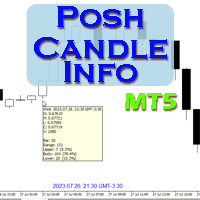
Show candle info with: Time in selected timezone Bar number Candle range points Upper wick points and percentage Body points and percentage Lower wick points and percentage Mark large/small candle body with customizable line. Settings group: Broker and local timezone. Lookback bars for candle marking. Large candle body Small candle body Date and time info with auto position or custom the x and y coordinate.
FREE

Midpoint Bands is a channel-like indicator that draws two lines on the chart - an upper band and a lower band, pointing out possible reversal levels.
This is one of the indicators used in the Sapphire Strat Maker - EA Builder.
Sapphire Strat Maker - EA Builder: https://www.mql5.com/en/market/product/113907
The bands are simply calculated like this:
Upper Band = (HighestHigh[N-Periods] + LowestHigh[N-Periods])/2 Lower Band = (LowestLow[N-Periods] + HighestLow[N-Periods])/2
FREE

Smart Copy is an Easy-to-Use EA that supports Multi Copying Metatrader4 and Metatrader5 and Local/Remote Copying. (Remote Version is coming soon)
This is Free Version and can be used on Demo accounts only. Use the Full Version for real trading.
Specifications :
Real Time, Multi Terminal - Multi Account - MT4/MT5 trade copying Copy from netting to hedge and hedge to netting is supported.
Fast and instant copy
All settings are input visually. Easy modifying symbol
FREE

Black Friday PROMO launch My portfolio . I am giving this expert advisor for FREE.
The Expert Advisor has been developed by AI for Nikkei and M15 timeframe. There is no need to set up parameters, all settings are already optimized and fine-tuned. Recommended broker RoboForex because of EET timezone.
My recommendation is to have a look also at the rest of my products in the portfolio, as they work very well together in combination. Check other portfolio screenshots.
Dax Ai , Daw Ai , Niki A
FREE
The MetaTrader Market is a simple and convenient site where developers can sell their trading applications.
We will help you post your product and explain you how to prepare your product description for the Market. All applications on the Market are encryption-protected and can only be run on a buyer's computer. Illegal copying is impossible.
You are missing trading opportunities:
- Free trading apps
- Over 8,000 signals for copying
- Economic news for exploring financial markets
Registration
Log in
If you do not have an account, please register
Allow the use of cookies to log in to the MQL5.com website.
Please enable the necessary setting in your browser, otherwise you will not be able to log in.