Watch the Market tutorial videos on YouTube
How to buy а trading robot or an indicator
Run your EA on
virtual hosting
virtual hosting
Test аn indicator/trading robot before buying
Want to earn in the Market?
How to present a product for a sell-through
Expert Advisors and Indicators for MetaTrader 4 - 72

SAW1c_Free SAW1c Free is a free scalper for GBPUSD. It differs from the paid version in a limited lot and a fixed Auto_Risk parameter. Working period M15. !!! On 4-digit quotes, the performance was not tested !!!
Input parameters: MagicNumber - identifier of orders; Max_Spread - Maximum spread when opening trades; Slippage - Maximum slippage; Stop_Loss - Stop loss size in points.
FREE

OVERVIEW
K-means is a clustering algorithm commonly used in machine learning to group data points into distinct clusters based on their similarities. While K-means is not typically used directly for identifying support and resistance levels in financial markets, it can serve as a tool in a broader analysis approach.
Support and resistance levels are price levels in financial markets where the price tends to react or reverse. Support is a level where the price tends to stop falling

Introducing Demarker Jurik—an innovative indicator poised to revolutionize your forex trading strategy. This indicator combines the precision of custom moving averages based on the Demarker indicator with the MetaTrader 4 indicator, Demarker.
Jurik moving averages are renowned for their accuracy and reliability in analyzing price movements in the forex market. They offer traders smoother representations of price action, filtering out noise and providing clearer signals for identifying trends
FREE

The indicator is a 15-minute signal indicator for all types of traders. Meaning, you could make lots of profits trading two different signals in one indicator.
NOTE: Both indicators are channels for achieving the same result. RED ARROW -- Sell Signal BLUE ARROW -- Buy Signal
Purchase now to be part of our community. We offer standard chart setups for both novice and intermediate traders. Trade with ease!
FREE
Простой, но полезный индикатор для контроля волатильности при внутридневной торговле. Индикатор наносит на текущий график уровни средней волатильности (ATR) за указанное количество дней. На текущем торговом дне уровни динамические и перемещаются в зависимости от минимума и максимума цены текущего дня в режиме "реального времени". Во входных параметрах мы задаем: - количество дней для расчета и отрисовки уровней среднего АТР - цвет линий уровней среднего АТР - толщину линий уровней среднего АТР
FREE

The Shenzhen Stock Exchange Session's Hours
This indicator facilitates observing the currency pair's quotations during subsequent parts of the stock exchange session live. Before the session starts, a rectangle is drawn on the chart but not filled in with color. It means the extent of the session duration. Before the first bar enters the rectangle of the session, a sound signal or pop-up window will notify us that the session will just start. When the price graph crosses the edge of the sessi
FREE

BOROT Assistant : Trading Assistant for Manual Traders
Description:
The Trading Assistant is a user-friendly tool designed for manual traders to improve their trading performance and enhance their decision-making process. It offers a comprehensive range of features that help traders effectively manage risk and reward, execute orders, and identify potential trading opportunities. The Assistant's key features include:
Risk and Reward Box : Clients can easily draw a risk and reward box on the
FREE

This is a simple indicator that shows the spread in points. It is useful for those like trade scalper, in addition to be customizable. Functions: Color - I don't need to explain :) Font type - I don't need to explain :) Font size - I don't need to explain :) Aditional text - aditional text after the spread number. Corner - specify the corner where the spread will be written. X position - horizontal distance from the edge. Y position - vertical distance from the edge. Check out our others indicat
FREE
PERIOD SEPARATOR ------------------------------------------------------------------------------------ Simple and unobtrusive utility for displaying weeks, days and hours Options to control the display of separator lines and labels allow you to customize them to your own taste Display of the separator lines either only in the main chart, or across any indicator windows Feedback and suggestions for improvement are warmly welcome.
FREE

Lampropeltis is a trend indicator. The algorithm of calculation is based on data from the standard indicators included in the MT4 package and interpretation of patterns formed by these indicators. The settings include a minimum set of parameters: Slow MA - slow MA period; Slow MA method - slow MA smoothing method; Fast MA - fast MA period; Fast MA method - fast MA smoothing method. Change of the signal color to red indicates the possibility of opening a Sell order. Change of the signal color to
FREE
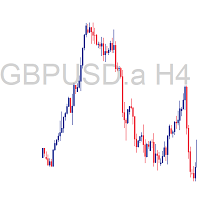
The Symbol and Timeframe Display Indicator for MetaTrader 4 (MQ4) is a versatile tool designed to enhance your trading experience by providing essential information about the current chart's symbol and timeframe directly on the screen. This user-friendly indicator offers customizable features that allow you to position the text display according to your preferences and enables convenient text toggling through keyboard interactions. Key Features: Symbol and Timeframe Display: The indicator promin
FREE

"Giant" is a flexible system in relation to trading strategies. It consists of two high-quality indicators that are installed on five different timeframes of the same currency pair (see screenshot). It monitors the trend and gives signals to open. The system passed a large number of checks and showed high accuracy. Indicators are sold separately. The second word in the main name is the indicator itself. This issue sells the indicator "Nicely" .
FREE

Necessary for traders: tools and indicators Waves automatically calculate indicators, channel trend trading Perfect trend-wave automatic calculation channel calculation , MT4 Perfect trend-wave automatic calculation channel calculation , MT5 Local Trading copying Easy And Fast Copy , MT4 Easy And Fast Copy , MT5 Local Trading copying For DEMO Easy And Fast Copy , MT4 DEMO Easy And Fast Copy , MT5 DEMO
The homeopathic indicator is also called the CCI indicator. The CCI indicator was propos
FREE

Key Features: Custom Image: The script allows you to set any image of your choice as the chart background. The image file should be in the .bmp format and located in the MQL4/Images folder of your MetaTrader 4 data folder. Automatic Replacement: If an image is already set as the chart background, the script will automatically replace it with the new image. How It Works: The script operates in the following manner: Initialization: Upon execution, the script checks if an object named “ i
FREE

Highly configurable Demarker indicator.
Features: Highly customizable alert functions (at levels, crosses, direction changes via email, push, sound, popup) Multi timeframe ability Color customization (at levels, crosses, direction changes) Linear interpolation and histogram mode options Works on strategy tester in multi timeframe mode (at weekend without ticks also) Adjustable Levels Parameters:
Demarker Timeframe: You can set the lower/higher timeframes for Demarker. Demarker Bar Shift: Y
FREE
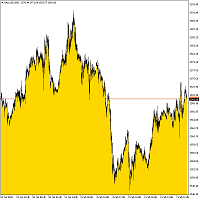
Bottom Background 4 The indicator sets the lower background of a certain color to the current price, depending on the settings. Description of indicator settings: MODE - three display options for the indicator: Low - display to the minimum price, Open / Close - display to the open or close price, whichever is lower, MA - display to the moving average. PeriodMA - moving average period.
FREE

The indicator displays elements of the trading system, name trading in the zone, described by Bill Williams. Sell signals are formed when MACD and OsMA values are falling simultaneously (Bill Williams calls these indicators АО and АС in his book), while buy signals appear when both indicators are rising. The indicator has no configurable parameters. (Indicator variant in which MACD and OsMA parameters can be changed - ZT Signal 2 AM ). The indicator signals are confirmed when the price exceeds t
FREE
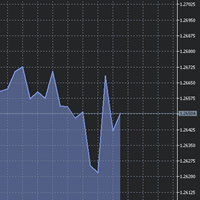
The utility Filled Area Chart adds to the standard set of price presentations. It is a brand new, nice price chart. You will certainly like it if you want to feel yourself a trader born under the Bloomber lucky star.
The Properties allow to set the colors and other things: Color preset - choose a preset or set to "Custom" and set your own colors using the properties below.
Custom area color - color of the area below the price line. Works only with Color preset = Custom.
Custom chart color -
FREE

This is a tool to measure the velocity of the price. It's completely free, you can download and use. "Way: distance of price after one tick." "Speed: price velocity after one tick." p/s: The time for the price to jump 1 tick will not be fixed, you should know this. If Way > 0, the indicator will change color to Green If Way < 0, the indicator will change color to Red || I am a 3D artist and I love math and programming! ||
FREE

EZT Bollinger Trendline
Indicator based on multiple settings of Bollinger Band. In the menu you can choose the similar settings than bollinger band indicator. Trend period and trend deviations. Also paint and arrow on chart when direction change. Three different kind of alert , such as pop up, e-mail and push notification. Try different settings on different timeframes.
Please help my work and rate and comment my products!
FREE
The script changes the timeframe of all open charts on the MetaTrader platform in a simple click without having to do it manually by going through all the open charts and changing them one by one, it is handy when there are many open charts. The script lets you choose which timeframe to apply to the open charts. The timeframes available in the dropdown menu are the ones already available on the MetaTrader platform : M1, M5, M15, M30, H1, H4, D1, W1, MN1.
FREE

Fast T3 MA Trend indicator derived from T3 moving averages. This indicator is part of the T3 Cloud MA indicator and is posted here on its own. Buying/Selling opportunities above/below line. The MA line can also be used as dynamic support/resistance for more aggressive entries. Use default values for best settings. The number of look back bars is user defined. This indicator can be used in combination with other strategies such as price action. Suitable for all time frames.
FREE
The purpose of this new version of the MT4 standard indicator provided in your platform is to display in a sub-window multiple timeframes of the same indicator. See the example shown in the picture below. But the display isn’t like a simple MTF indicator. This is the real display of the indicator on its timeframe. Here's the options available in the FFx indicator: Select the timeframes to be displayed (M1 to Monthly) Define the width (number of bars) for each timeframe box Alert pop up/sound/ema
FREE

This indicator provides a statistical analysis of price changes (in points) versus time delta (in bars). It calculates a matrix of full statistics about price changes during different time periods, and displays either distribution of returns in points for requested bar delta, or distribution of time deltas in bars for requested return. Please, note, that the indicator values are always a number of times corresponding price change vs bar delta occurred in history. Parameters: HistoryDepth - numbe
FREE
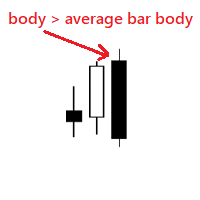
Very simple indicator that shows if body of a new bar is bigger than the average bar body. We can use the indicator to notice bars that are bigger than usual, for example this could mean a new trend. Input params: history bars to display from how many bars to get the average bar body To calculate only bars from the same type distance for the dots bull color bear color dot size
FREE

Footmarks Pro Footmarks Pro is a MetaTrader 4 Essential Indicator that create round number or sweetspot on chart with "Button". Parameter Indicator Name - Footmarks Pro Pair Selection - 250 points / 500 points / 1000 points Sweetspot Setting Sweetspot Line Color Sweetspot Line Style Sweetspot Line Thickness Sweetspot Button Setting Button Axis-X Button Axis-Y Thanks...
FREE

This is an implementation of the market cycle indicator described by Raghee Horner in the book "Forex Trading for Maximum Profit" . The current state of the market can be determined by analyzing the inclination angle of the exponential moving average (EMA) running on a period of 34 bars. If the EMA inclination is defined as the direction of the hour hand on the dial from 12 to 2 hours, then an uptrend is considered to be present; from 2 to 4 hours, the market consolidates; from 4 to 6 hours, a d
FREE
Spread Monitoring is a unique product for analyzing a spread. Unlike most similar indicators, Spread Monitoring uses ticks rather than bars allowing you to detect abnormal spread expansions. Features
Works on ticks rather than bars. Simple and easy indicator configuration. Works on all timeframes. Works on any financial instrument. No repainting.
Parameters
Total - number of displayed ticks. clrSpread - indicator line color.
FREE

Do you need precision? Tick charts show each change in the ask or bid; The chart updates whenever either price changes. Study the markets more deeply, with surgical precision. Tick Chart Window saves all the received ticks and shows them into a seperate window. Get the best entry price in the Market. trade with precision trade good Spread Register In the comment section you will see the highest spread, the lowest spread and the average spread since the indicator was loaded.
FREE

What is Squeeze? A contraction of the Bollinger Bands inside the Keltner Channel reflects a market taking a break and consolidating, and is usually seen as a potential leading indicator of subsequent directional movement or large oscillation movement. When Bollinger bands leave Keltner Channel, it means markets switching from a low volatility to high volatility are something all traders are looking for. Differences
Squeeze FREE
Squeeze
Squeeze PRO How many different timeframes
1
5
10
FREE

This is a simple risk/reward setter. You enter your TP and SL in the currency amount and it sets it for you, you set your targets in money (not in pips), it helps beginners who are still learning about risk/reward ratios to set their risk/reward based on their capital or amount of money. For example, if you want to risk $3 to make $10, you just fill it in and it sets your order targets accordingly. You can set the TP and SL per chart or all opened charts only. Please make sure your targets are r
FREE

Rua Trend Pro This is an indicator that helps identify Trends relatively accurately. Can be used for any currency pair. And usable on all time frames. Recommended use from M15 and above. You can use it to identify trends, or to identify reversals very well. Input parameters: in_TradePeriod in_StopPeriod in_Alerts A product of Ruacoder Provide code indicator and EA services upon request
FREE
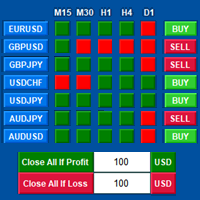
Tools designed for multi-currency trading.
You can customize which currency you want to trade, analyze up to 10 currencies by yourself. Note: This is demo version that you can test for free (Maximum Lot Size = 0.01) Full version can be found here: https://www.mql5.com/en/market/product/17793
Analysis method. (Refer to screenshot 1) Ultimate dashboard analyzes trend strength from six major time frames: M5, M15, M30, H1, H4, D1 Show the result in graphic format. You can identify which currenci
FREE

MAS Indicator can be used in all currency pairs and at any timeframe, it is suitable for any trading speed. In addition, it's relatively easy to trade with the MAS Indicator. This indicator produces two signals: BUY Signal: arrow deep sky blue SELL Signal: arrow red
Indicator parameters MA Method – type of moving average MA Shift – shift moving average Fast - fast period moving average Slow – slow period moving average RSI – value rsi Confirm – value confirm Flat – value flat Colors - colors o
FREE

The Price Volume Trend Oscillator (PVTO) is a powerful technical analysis tool designed to provide insights into the relationship between price movements and trading volumes. This indicator offers a unique perspective on market trends, helping traders identify potential buying and selling opportunities. Parameters: EMA Short Period: Defines the short EMA period for calculating the PVTO. Default 3 EMA Long Period: Specifies the long EMA period for PVTO calculation. Default 10 EMA Signal Period: S
FREE

Expert with martingale strategy, to experiment. A profit trade offsets a loss trade. An example: Cent-Account, 35 USD are then 3500 USD. Account: USD and 1: 400 EA setting: Cat_type Normal, Variant 1, BaseLot 0.1 If the case occurs with two loss trades in a row , the loss is about 3000 USD . Two loss trades in a row can be avoided by a low spread and continuous trade of the EA. Signal: https://www.mql5.com/en/market/product/22450#!tab=comments&comment=5808183
Technical specifications Underlyin
FREE

Due to policy changes in MQL5.com, we cannot continue our free trial program here. However, you can request to test our EA in live account though here . Limitless EA is a martingale based EA , which provide a lot of configuration to customize your martingale strategy to suit your personal risk profile . Trading Strategy Main characteristic of this EA: Martingale based strategy. Determine very short term trend as the aim is to get small profit on each trade. Open more trades to e
FREE

The presented indicator marks signals on the price chart with arrows in accordance with the data of the Hull Momentum AM indicator. The indicator gives a signal and sends a notification to the mobile terminal and email. The indicator is part of a series of indicators - Hull Line AM, Hull Momentum AM, Hull Candles AM, Hull Signal AM . For a better understanding of the operation of each of the indicators, it is recommended to start working with them by using them together on one chart. The Hull M
FREE

Delete big amounts of orders, in just a few clicks. Drag the script to any chart to delete open and pending orders, you can delete all the orders from the account or delete a specific order groups, identifying them by magic number. You can modify the parameter MAGICN on the followay way: - Introduce the magic number that was used to place the orders you want to delete, the script will delete all pending and open orders that were placed with that magic number. - Also, introduce 0 (cero) to delete
FREE

This is a regression tree indicator for MT4/MT5.
This indicator classificate nodes on the time period so that the deviation becomes smaller,
and displays regression line and channel for each node.
It's free!
Attached CartDemo.ex4 and CartDemo.ex5 is a Demo version and has the following limitations:
Method is RandomForest only
Maximum number of bars is 200
Maximum number of trees is 2
Maximum tree depth is 2
Calculated waste lines are shown
Not display correlation coefficients
Fu
FREE
The purpose of this new version of the MT4 standard indicator provided in your platform is to display in a sub-window multiple timeframes of the same indicator. See the example shown in the picture below. But the display isn’t like a simple MTF indicator. This is the real display of the indicator on its timeframe. Here's the options available in the FFx indicator: Select the timeframes to be displayed (M1 to Monthly) Define the width (number of bars) for each timeframe box Alert pop up/sound/ema
FREE
Forex Calculator is a must-have program for every trader. This script allows you to calculate the percentage% risk of a deposit depending on the set Stop Loss in pips. The advantages of the script: You always know exactly what you are risking in every trade The calculator takes into account the contract specification Only 2 columns for data entry risk and Stop Loss size in pips Recommended Robot Scalper - https://www.mql5.com/en/market/product/77108
Options Risk_in_% – the percentage of
FREE

The utility is designed to close several types of orders. Closing is done by pressing the hot key. How to place and delete orders by voice using the utilities of this type, see the video below the description. https://www.youtube.com/channel/UCTpVWJkEic6TzoXr0qc9RIw/featured Provided closing options:
KEY "1" DELETE BUY STOP. KEY "2" DELETE SELL STOP. KEY "3" DELETE BUY AND SELL STOP. KEY "4" DELETE BUY LIMIT. KEY "5" DELETE SELL LIMIT. KEY "6" DELETE BUY AND SELL LIMIT. KEY "7" DELETE ALL PEN
FREE
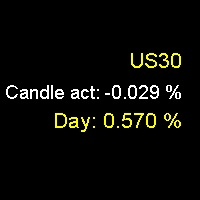
Daily Percentage and Current Candle Would you like to know how much an asset has risen or fallen in a day or in the last candle? Do you want a numerical reference for the strength and direction of price movement? Then, the Daily Percentage and Current Candle indicator is the tool you need. The Daily Percentage and Current Candle indicator shows you the percentage increase or decrease of an asset in the current day or in the last candle, depending on the timeframe you choose. The indicator allows
FREE

Created for signal providers, as well as for participation in various forex contests(and not only), can independently open an unlimited number of orders on the indicators Moving Average A series of experts: Lucky Star RSI and MACD, Lucky Star WPR, Lucky Star MA, Lucky Star RSI, Lucky Star SO, Lucky Star MACD, Lucky Star MA and SO, Lucky Star MA and MACD ,Lucky Star SO and MACD the probability of winning real money in management or bonuses to real accounts ( read more on this in my blog ). EA
FREE

This utility sends you Telegram messages about: open a new position (can be disabled) change the current position (Stop Loss / Take Profit) (can be disabled) close current position (can be disabled)
Symbol: all Symbols current Symbol
Directions of deals: buy and sell only buy (long) only sell (short)
Magic number: all magic numbers only for a specific magic
Type deals/orders: market deals (buy / sell) limit orders (buy limit / sell limit) stop orders (buy stop / sell stop) stop limit or
-It deletes all graphical objects on a chart. You choose the chart , then you execute the script on the chart. After the execution, all objects will disappear. Objects can be lines: trend lines, horizontal lines, vertical lines. They can be buttons, texts, labels , rectangles, edit boxes... parts of a panel. It executes fast within a second. You can use as many times as you want.
FREE
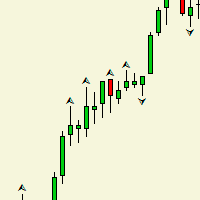
Индикатор рисует на графике фрактал, и в чем отличие между обычным фракталом? спросите вы. Ответ таково,_ после формирования второго бара фрактал рисуется и не удаляется в отличие от обычного. Данный индикатор создан в целях расширения Торгового робота. Она составляет одним из важнейших частью робота. Таким как выход из торгов. У индикатора нет входных параметров.
FREE
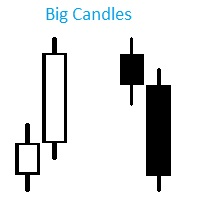
Индикатор Big Candles показывает кратное превышение размера свечи относительно среднего показателя рассчитанного за определенный период. Индикатор отмечает размер свечи на графике в пипсах и сигнализирует о появлении “большой” свечи. Описание параметров: HistoryBars - Количество баров для отображения индикатора countN - Период расчета среднего размера свечи f actor - Во сколько раз длина свечи превышает средннее значение, для отображения сигнала
FREE
Operations Monitor It is a simple but powerful monitor, which allows not to use the Terminal to have a cleaner chart.
Informs about all the operations opened in that Asset: Number of Open Operations Lost / profit Account Percentage Volume operated Colors: RED: the sum of operations is lost BLUE: the sum of operations is in profits Fonts: Allows change the font size.
FREE
Индикатор Candle Body Histogram отображается в отдельном окне и показывает размер тела каждой свечи в виде гистограммы. В зависимости от того растёт свеча на графике или снижается, гистограмма меняет свой цвет. Свечи "доджи", у которых совпадают цены открытия и закрытия, так же отображаются на гистограмме отдельным цветом. Поскольку индикатор строится от нулевого значения, он позволяет визуально сравнить тела свечей относительно друг друга. На гистограмме можно разместить уровни, чтобы отслежив
FREE

This indicator displays the signals based on the values of the classic RSI indicator on the price chart. The RSI can be used for determining the overbought or oversold areas on the chart. Reaching these levels means that the market can soon turn around, but it does not give signal, as in a strong trend the market can stay in the overbought or oversold state for quite a long time. As with most oscillators, the signals are generated when leaving these areas. This indicator allows to display three
FREE

Индикатор реализован для определения классического канала движения цены, который используется на крупных биржевых площадках. Не перерисовывается Синий уровень - это уровень поддержки Красный уровень - это уровень сопротивления Белый уровень - является Pivot-уровнем Настройки Period_SEC - ввод значения периода . Примечание: Индикатор определяет уровни только на пятизначных котировках! Метод торговли: Открытие позиций осуществляется от уровней , именно на их значениях происходит отскок цены
FREE

Scientific Calculator is a script designed to compute expressions of science, engineering and mathematics.
General Description
The expression to calculate must obey syntax rules and precedence order, being constituted by the following elements: Integer and real numbers. Mathematical operators for addition (+), subtraction (-), multiplication (*), division (/) and exponentiation (^). Mathematical and trigonometric functions . Curved parentheses (()) to define the precedence and c
FREE

Close Manager EA for MetaTrader 4 Introduction: The Close Manager EA is an essential tool designed to streamline trade closure processes in MetaTrader 4. This expert advisor is crafted to efficiently manage trade closures initiated manually or by other EAs using a set of diverse and customizable criteria. It aims to provide traders with enhanced control over their trades, optimizing exit strategies for better risk management and trade performance. You can find the MT5 version here
Key Featur
FREE

CCFp (Complex_Common_Frames percent) is a measure of currency strength.
Shows the total rate of change of “short-term moving average” and “long-term moving average” for each currency.
Supports eight major currencies: USD, EUR, JPY, CHF, GBP, AUD, CAD and NZD.
1). Displays the currency name at the right end of the graph.
2). You can change the display color of each currency.
3). Moving average smoothing type (ENUM_MA_METHOD) can be selected.
4). Price constant (ENUM_APPLIED_PRICE
FREE
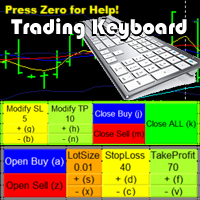
Trading Keyboard Tool will enable you to: Easily OPEN/CLOSE/MODIFY orders with Keyboard and with Buttons on Screen. Modify Order parameters with shorcuts.
Export different Prices into a file for analysing outside MT4. Save Chartscreen into an image. Show Fibonacci on screen with shorcut.
You can export these Prices into files:
COHL : history of Close,Open,High,Low in one file.
Close - history of Close in one file. Open - history of Open in one file. High - history of High in one f
FREE

This is a simple script that places a defined number of lines above and below a given price. The script lets you set the number of lines, the separation in pips and the color. Instructions:
Drop the script on a chart to draw the level lines If the last parameter is set to false, the script will delete the lines previously placed by it.
Parameters:
English? Turn it yes to use English language, false will turn language to Spanish Separation Set the pips distance among lines From Price
FREE

Follow the trail of the comet to know the development of the trend. This indicator helps you to determine the evolution of the price depending on how these astronomical objects are shown in the chart. When the comet seems to stop, it opens its tails considerably and warns us of a possible change in trend. On the contrary, when it seems to get speed (looks thin because lines of tail are grouped) demonstrates safety and continuity in trend. The head or comet nucleus will show red or green accordin
FREE

Spin is an intrinsic form of angular momentum carried by elementary particles, composite particles (hadrons), and atomic nuclei.
Spin is one of two types of angular momentum in quantum mechanics, the other being orbital angular momentum. The orbital angular momentum operator is the quantum-mechanical counterpart to the classical angular momentum of orbital revolution and appears when there is periodic structure to its wavefunction as the angle varies.For photons, spin is the quantum-mechanica
FREE

A ratio between 0 and 1 with the higher values representing a more efficient or trending market, It is used in the calculation of Perry J. Kaufman Adaptive Moving Average (KAMA), dividing the price change over a period by the absolute sum of the price movements that occurred to achieve that change. The Fractal Efficiency or also known as Efficiency Ratio was first published by Perry J. Kaufman in his book ‘Smarter Trading‘. This is mostly considered a filter for volatile markets none the less
FREE

Welcome to... EA MAX Robot Symbol Takeprofit
It is a machine for facilitating profit collection. And close the order in one click It can also be set to automatically collect the desired amount of profit. Can only be used in one currency pair Cannot be used on multiple currency pairs in one currency window. If you are looking for a tool based on this feature Bring this tool to use.
FREE

The purpose of this new version of the MT4 standard indicator provided in your platform is to display in a sub-window multiple timeframes of the same indicator. See the example shown in the picture below. But the display isn’t like a simple MTF indicator. This is the real display of the indicator on its timeframe. Here's the options available in the FFx indicator: Select the timeframes to be displayed (M1 to Monthly) Define the width (number of bars) for each timeframe box Alert pop up/sound/ema
FREE

Hello everyone, this is another utility that I wrote specifically for users using my profile with a large number of experts and sets ( https://www.mql5.com/en/blogs/post/750723 ) . This utility is useful for working with a profile using grid strategies (averaging and martingale). As we know, such strategies periodically fall into a large drawdown and you need to be careful when opening averaging positions (do not open too many). In my profile, I use a limit of 3 positions for each EA, if this w
FREE

Индикатор сглаженного MACD (xMACD)
Входные параметры: Fast EMA Period - период быстрой EMA Slow EMA Period - период медленной EMA Signal SMA Period - период сигнальной SMA Applied Price - тип цены (0 - CLOSE | 1 - OPEN | 2 - HIGH | 3 - LOW | 4 - MEDIAN | 5 - TYPICAL | 6 - WEIGHTED) Принцип работы Индикатор перерассчитывает стандартный технический индикатор MACD (дважды усредняет получаемые значения). Индикаторный буфер не перерисовывается.
FREE

Based on a combination of indicators, E13 Acid Fulx is an excellent indicator for knowing when to buy or sell on any asset and temporaryity. The indicator myself I have used it as a tool for my analysis when trading Forex. It is a useful and easy-to-understand trend indicator. If you combine it with your own analyses you will surely get a good result in your operation.
FREE

Introduction:
Many traders may face such a situation (at least I have experienced it), they need to set a magic number for the order they want to enter manually, but it is time-consuming to modify an EA for an individual order.
So, I want to create a simple tool. As long as I enter some parameters, I can place an order with magic number so that I can do additional operations on this order by some EA in the future.
This tool is to realize such a simple function: set magic number when placing a
FREE

It is a demo version of Advanced Arrow indicator It works only on GBPJPY but the full version works on all currency pairs.
Features Simply it gives you entry point ,SL line and 4 TP lines or less. Once SL-TP lines are shown with the arrow, they remains as they are until signal change. It is historical indicator. No Repaint.
Indicator parameters Indicator Version : choose V5 or V6. TP 1 Line color : TP1 color. TP 2 Line color : TP2 color. TP 3 Line color : TP3 color. TP 4 Line color : TP4 co
FREE

Did you ever encounter a problem that your terminal failed to reestablish a connection and caused your EA to stop working? How much money did you lose because you were not aware of the connection error? Worry no more, I am here to present you a solution for your nightmare. This utility indicator sends a real time push notification or email when your terminal encounters a connection failure. You will be notified immediately even if your terminal is yet to establish a success connection to your br
WalkForwardOptimizer library allows you to perform rolling and cluster walk-forward optimization of expert advisers (EA) in MetaTrader 4.
To use the library include its header file WalkForwardOptimizer.mqh into your EA source code, add call provided functions as appropriate.
Once the library is embedded into EA, you may start optimization according to the procedure described in the User guide . When it's finished, intermediate results are saved into a csv-file and some special global variabl
MetaTrader Market - trading robots and technical indicators for traders are available right in your trading terminal.
The MQL5.community payment system is available to all registered users of the MQL5.com site for transactions on MetaTrader Services. You can deposit and withdraw money using WebMoney, PayPal or a bank card.
You are missing trading opportunities:
- Free trading apps
- Over 8,000 signals for copying
- Economic news for exploring financial markets
Registration
Log in
If you do not have an account, please register
Allow the use of cookies to log in to the MQL5.com website.
Please enable the necessary setting in your browser, otherwise you will not be able to log in.