Is MT5 optimization even realistic ?
It appears that I'm having some difficulty understanding MT5 optimization and forward testing, but for now, I'll focus on optimization. In certain situations, I've had highly profitable optimizations, which I can divide into two sections: optimizing over a large three-year historical data and optimizing over the most recent three months or so.
However, after optimizing a strategy for three years and achieving very profitable results, I encountered problems when forward testing for at least the latest one or three months. The results showed continuous losses. This leads me to wonder whether optimization can truly be relied upon or if there's a better approach to achieve consistent profitability each month.
I find MT5 optimization puzzling because it seems to yield average profitability, where there are three profitable months and ten losing months. Even though the three profitable months have higher profits than the subsequent ten months, the EA still presents a seemingly profitable curve.
I request guidance from someone who can help me, as well as others in a similar situation, understand the correct optimization process or one that can realistically exhibit profitable parameters every month. Sometimes, during optimization, I end up with very few trades, like one trade per month.
From what I know: optimization in one form(from the tester) or another is almost inevitable. Unless you rely on an algorithm which follows only binary conditions/features, you will face variables to set. Either you fix them arbitrarily, and it has little chance to be optimal, or you search for their optimal values with the automatic process. The optimizer do the later, but on past data. And you can't be sure whether these values will be optimal on future data or not. Still it is admitted that the better it works with some parameters values on past data, the better it tends to work on future data also. The forward process is intended to show this continuity.
The optimizer searches for optimal values depending on a given criterion. If it is "balance max", it doesn't bother if the profit was made on 3 months out of 10. Otherwise you need to implement a custom criterion that integrates the regularity concept. This being said I'm not sure wanting some profit every month is the best approach. I would prefer winning 1000$ 35 months and loosing 1$ 1 month, rather than winning 1$ 36 months. Better making a quantitative trade-off between regularity and profit. You can also integrate the number of trades in the custom criterion.
Finally if your EA isn't profitable on forward testing, it is probably because your strategy isn't good.
It appears that I'm having some difficulty understanding MT5 optimization and forward testing, but for now, I'll focus on optimization. In certain situations, I've had highly profitable optimizations, which I can divide into two sections: optimizing over a large three-year historical data and optimizing over the most recent three months or so.
However, after optimizing a strategy for three years and achieving very profitable results, I encountered problems when forward testing for at least the latest one or three months. The results showed continuous losses. This leads me to wonder whether optimization can truly be relied upon or if there's a better approach to achieve consistent profitability each month.
I find MT5 optimization puzzling because it seems to yield average profitability, where there are three profitable months and ten losing months. Even though the three profitable months have higher profits than the subsequent ten months, the EA still presents a seemingly profitable curve.
I request guidance from someone who can help me, as well as others in a similar situation, understand the correct optimization process or one that can realistically exhibit profitable parameters every month. Sometimes, during optimization, I end up with very few trades, like one trade per month.
- Choose strategies where the base strategy is simple, typically based on no more than 2-3 values. It should be profitable at the default values.
- Depending on your goals, optimize on just about anything other than Balance. All the others will in some way help smooth your curve - Balance will gladly exchange long losing periods for more profit in the long run. I highly recommend using the Complex Criterion max if you're not absolutely sure.
- Start your optimization at the default values, and then first optimize only on the main values, starting from the default range. For example, you're testing a strategy that's designed for a 20/200 MA crossover, it had better be profitable with the values 20/200, and a very, very basic default stop loss, e.g. 2xATR. If it requires more tuning than that, skip it. From there, just optimize around those, e.g., range the fast MA from 8-50 (step=1) and the slow MA from 90-250 (in steps of 5 or 10 for efficiency). That combination is small enough to do a slow complete algorithm. Only optimize initially on the two most important variables. Export your results to Excel, and throw it into a pivot table. Do conditional formatting on your table with a color scale. That'll give you something like this:
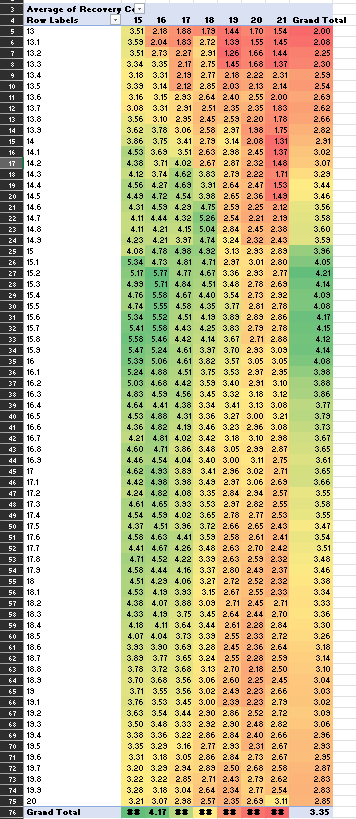
This is one of the best techniques I've figured out so far to help prevent overfitting. You don't look for the single highest value -- you look for the center of the darkest green blob (color-coding the totals row/column each on their own scale will usually help too). BTW, you can do this on any single value, as well - just doesn't work well on 3+ values (make your 3rd value a filter). - Optimizing other values - From there, try optimizing a pair of values at a time, in decreasing order of importance.
- If your EA can trade on any tick, not just candle closes, make sure you're optimizing with real tick data. This can make a huge difference.
- I *highly* recommend implementing this: R-squared as an estimation of quality of the strategy balance curve - MQL5 Articles. Strategies with higher R-squared (or LR correlation, which is calculated automatically on single tests, but not available as an optimization criterion) have fewer of those long periods of unprofitability, and also generally do better on out-of-sample data.
- Forward testing - At a minimum, I optimize on 2020-2022, then forward test 2023. Test within the green range of values from above. To best balance your optimization and forward testing, in Excel, I suggest adding two columns - one for the average, another for the difference. This allows you to sort/filter based on that. This will give you an average performance that's weighted towards the more recent results, but is still viable long-term. This works particularly well with the Complex Criterion max, as it factors in all the metrics and number of trades.
- Statistical significance - You need hundreds of trades, generally. If you don't have them, run a longer test period. There are exceptions. For example, let's say you figure out that if you buy when the stochastic value bounces off 0, and that's a 100% win rate over the max time available, even if it's only a dozen trades... well, that's probably a good bet. Not steady, reliable profits, but if you've got room for it on your VPS.. and especially if you can make it a multi-symbol EA, then go for it. But generally, yeah, 100+ trades for statistical significance.
- Test on out-of-sample data, but use it as a guide, not an absolute filter. Market dynamics change. If you've run a forward optimization from 2020-current, with YTD forward testing, that's been through a wide variety of market conditions. But still, go run it on 2017-2019 and see how it does. If it performs poorly, try to figure out if there's particular market conditions that are contributing to that. And if so, can you code around that as a filter?
I think the biggest thing for me has been focusing on simpler strategies, making sure it's reasonably profitable with the default values, and then optimizing step-by-step in order of priority. Take a good strategy and make it better.

- www.mql5.com
- Choose strategies where the base strategy is simple, typically based on no more than 2-3 values. It should be profitable at the default values.
- Depending on your goals, optimize on just about anything other than Balance. All the others will in some way help smooth your curve - Balance will gladly exchange long losing periods for more profit in the long run. I highly recommend using the Complex Criterion max if you're not absolutely sure.
- Start your optimization at the default values, and then first optimize only on the main values, starting from the default range. For example, you're testing a strategy that's designed for a 20/200 MA crossover, it had better be profitable with the values 20/200, and a very, very basic default stop loss, e.g. 2xATR. If it requires more tuning than that, skip it. From there, just optimize around those, e.g., range the fast MA from 8-50 (step=1) and the slow MA from 90-250 (in steps of 5 or 10 for efficiency). That combination is small enough to do a slow complete algorithm. Only optimize initially on the two most important variables. Export your results to Excel, and throw it into a pivot table. Do conditional formatting on your table with a color scale. That'll give you something like this:
This is one of the best techniques I've figured out so far to help prevent overfitting. You don't look for the single highest value -- you look for the center of the darkest green blob (color-coding the totals row/column each on their own scale will usually help too). BTW, you can do this on any single value, as well - just doesn't work well on 3+ values (make your 3rd value a filter). - Optimizing other values - From there, try optimizing a pair of values at a time, in decreasing order of importance.
- If your EA can trade on any tick, not just candle closes, make sure you're optimizing with real tick data. This can make a huge difference.
- I *highly* recommend implementing this: R-squared as an estimation of quality of the strategy balance curve - MQL5 Articles. Strategies with higher R-squared (or LR correlation, which is calculated automatically on single tests, but not available as an optimization criterion) have fewer of those long periods of unprofitability, and also generally do better on out-of-sample data.
- Forward testing - At a minimum, I optimize on 2020-2022, then forward test 2023. Test within the green range of values from above. To best balance your optimization and forward testing, in Excel, I suggest adding two columns - one for the average, another for the difference. This allows you to sort/filter based on that. This will give you an average performance that's weighted towards the more recent results, but is still viable long-term. This works particularly well with the Complex Criterion max, as it factors in all the metrics and number of trades.
- Statistical significance - You need hundreds of trades, generally. If you don't have them, run a longer test period. There are exceptions. For example, let's say you figure out that if you buy when the stochastic value bounces off 0, and that's a 100% win rate over the max time available, even if it's only a dozen trades... well, that's probably a good bet. Not steady, reliable profits, but if you've got room for it on your VPS.. and especially if you can make it a multi-symbol EA, then go for it. But generally, yeah, 100+ trades for statistical significance.
- Test on out-of-sample data, but use it as a guide, not an absolute filter. Market dynamics change. If you've run a forward optimization from 2020-current, with YTD forward testing, that's been through a wide variety of market conditions. But still, go run it on 2017-2019 and see how it does. If it performs poorly, try to figure out if there's particular market conditions that are contributing to that. And if so, can you code around that as a filter?
I think the biggest thing for me has been focusing on simpler strategies, making sure it's reasonably profitable with the default values, and then optimizing step-by-step in order of priority. Take a good strategy and make it better.
thank you scot
- Choose strategies where the base strategy is simple, typically based on no more than 2-3 values. It should be profitable at the default values.
- Depending on your goals, optimize on just about anything other than Balance. All the others will in some way help smooth your curve - Balance will gladly exchange long losing periods for more profit in the long run. I highly recommend using the Complex Criterion max if you're not absolutely sure.
- Start your optimization at the default values, and then first optimize only on the main values, starting from the default range. For example, you're testing a strategy that's designed for a 20/200 MA crossover, it had better be profitable with the values 20/200, and a very, very basic default stop loss, e.g. 2xATR. If it requires more tuning than that, skip it. From there, just optimize around those, e.g., range the fast MA from 8-50 (step=1) and the slow MA from 90-250 (in steps of 5 or 10 for efficiency). That combination is small enough to do a slow complete algorithm. Only optimize initially on the two most important variables. Export your results to Excel, and throw it into a pivot table. Do conditional formatting on your table with a color scale. That'll give you something like this:
This is one of the best techniques I've figured out so far to help prevent overfitting. You don't look for the single highest value -- you look for the center of the darkest green blob (color-coding the totals row/column each on their own scale will usually help too). BTW, you can do this on any single value, as well - just doesn't work well on 3+ values (make your 3rd value a filter). - Optimizing other values - From there, try optimizing a pair of values at a time, in decreasing order of importance.
- If your EA can trade on any tick, not just candle closes, make sure you're optimizing with real tick data. This can make a huge difference.
- I *highly* recommend implementing this: R-squared as an estimation of quality of the strategy balance curve - MQL5 Articles. Strategies with higher R-squared (or LR correlation, which is calculated automatically on single tests, but not available as an optimization criterion) have fewer of those long periods of unprofitability, and also generally do better on out-of-sample data.
- Forward testing - At a minimum, I optimize on 2020-2022, then forward test 2023. Test within the green range of values from above. To best balance your optimization and forward testing, in Excel, I suggest adding two columns - one for the average, another for the difference. This allows you to sort/filter based on that. This will give you an average performance that's weighted towards the more recent results, but is still viable long-term. This works particularly well with the Complex Criterion max, as it factors in all the metrics and number of trades.
- Statistical significance - You need hundreds of trades, generally. If you don't have them, run a longer test period. There are exceptions. For example, let's say you figure out that if you buy when the stochastic value bounces off 0, and that's a 100% win rate over the max time available, even if it's only a dozen trades... well, that's probably a good bet. Not steady, reliable profits, but if you've got room for it on your VPS.. and especially if you can make it a multi-symbol EA, then go for it. But generally, yeah, 100+ trades for statistical significance.
- Test on out-of-sample data, but use it as a guide, not an absolute filter. Market dynamics change. If you've run a forward optimization from 2020-current, with YTD forward testing, that's been through a wide variety of market conditions. But still, go run it on 2017-2019 and see how it does. If it performs poorly, try to figure out if there's particular market conditions that are contributing to that. And if so, can you code around that as a filter?
I think the biggest thing for me has been focusing on simpler strategies, making sure it's reasonably profitable with the default values, and then optimizing step-by-step in order of priority. Take a good strategy and make it better.
hey scott is it okay if i contact you on mql5 chat for more clarification on this method am still a learner and not very much experience i have read the article but may be i would need more of your help in understanding this method ,and moreso if i have to pay you for sure i will am not gonna bother you sir i genwinly need assistance if thats okay
hey scott is it okay if i contact you on mql5 chat for more clarification on this method am still a learner and not very much experience i have read the article but may be i would need more of your help in understanding this method ,and moreso if i have to pay you for sure i will am not gonna bother you sir i genwinly need assistance if thats okay
Yeah, absolutely. No pay - just give me feedback and tell me what you learn when you go and work with it yourself. I'm not a pro at this yet, just maybe a bit further along the journey than you are. And it's hard finding people to collaborate with. What you asked about has been what I've been almost entirely full-time focused on for the past few months.
Yeah, absolutely. No pay - just give me feedback and tell me what you learn when you go and work with it yourself. I'm not a pro at this yet, just maybe a bit further along the journey than you are. And it's hard finding people to collaborate with. What you asked about has been what I've been almost entirely full-time focused on for the past few months.
okay first you proposed this article R-squared as an estimation of quality of the strategy balance curve - MQL5 Articles. but i got like 32 errors from that file from that article would you mind sharing or fixing the file on that article or share?

- www.mql5.com
okay first you proposed this article R-squared as an estimation of quality of the strategy balance curve - MQL5 Articles. but i got like 32 errors from that file from that article would you mind sharing or fixing the file on that article or share?
okay first you proposed this article R-squared as an estimation of quality of the strategy balance curve - MQL5 Articles. but i got like 32 errors from that file from that article would you mind sharing or fixing the file on that article or share?
There's a LOT of article there that's just explaining the code he wrote, not what you have to do to implement it. For a basic implementation, you just need to add these includes:
#include <Expert\Strategy\TimeSeries.mqh>
#include <Expert\Strategy\Strategy.mqh>
And this OnTester() at the end:
double OnTester()
{
   return CustomR2Balance();
}
But that will only give you R-squared based on the balance. If you're trading intraday and your drawdowns are based more on your losing trades than the drawdowns during the trades, that might be acceptable. If you're swing/position trading and more concerned about the equity drawdowns, then you'll need more implementation. If your EA is based on CStrategy (as the wizard-generated ones all are), then I think you should just be able to change the OnTester() to CustomR2Equity() (haven't tried it yet — on my to-do list). Otherwise, the article says you'll need to implement the equity listener yourself — which seems to me like it should be simpler than trying to convert all my EAs to use CStrategy. But I haven't worked this out yet (also on my to-do list).
- Free trading apps
- Over 8,000 signals for copying
- Economic news for exploring financial markets
You agree to website policy and terms of use
It appears that I'm having some difficulty understanding MT5 optimization and forward testing, but for now, I'll focus on optimization. In certain situations, I've had highly profitable optimizations, which I can divide into two sections: optimizing over a large three-year historical data and optimizing over the most recent three months or so.
However, after optimizing a strategy for three years and achieving very profitable results, I encountered problems when forward testing for at least the latest one or three months. The results showed continuous losses. This leads me to wonder whether optimization can truly be relied upon or if there's a better approach to achieve consistent profitability each month.
I find MT5 optimization puzzling because it seems to yield average profitability, where there are three profitable months and ten losing months. Even though the three profitable months have higher profits than the subsequent ten months, the EA still presents a seemingly profitable curve.
I request guidance from someone who can help me, as well as others in a similar situation, understand the correct optimization process or one that can realistically exhibit profitable parameters every month. Sometimes, during optimization, I end up with very few trades, like one trade per month.