Hello all!
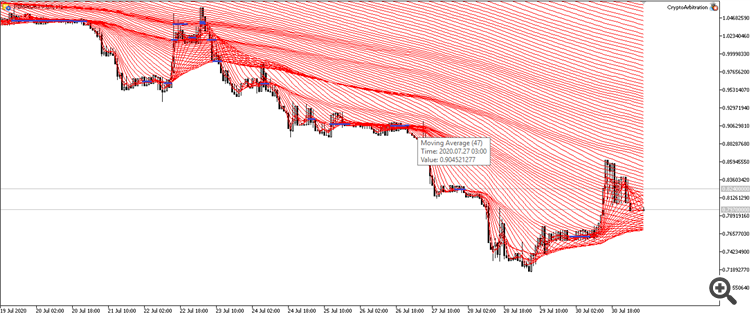
We have an array of values - 500 Moving Averages for each bar
How can we calculate the resulting harnesses?:
- When changing direction ?
Maybe you know where to swim !
I was advised to dive into Kohonen Maps, well I haven't figured it out !
Hello all!
We have an array of values - 500 Moving Averages for each bar
How can we calculate the resulting harnesses?:
- When changing direction ?
Maybe you know where to swim !
I was advised to dive into Kohonen Maps, well I haven't figured it out !
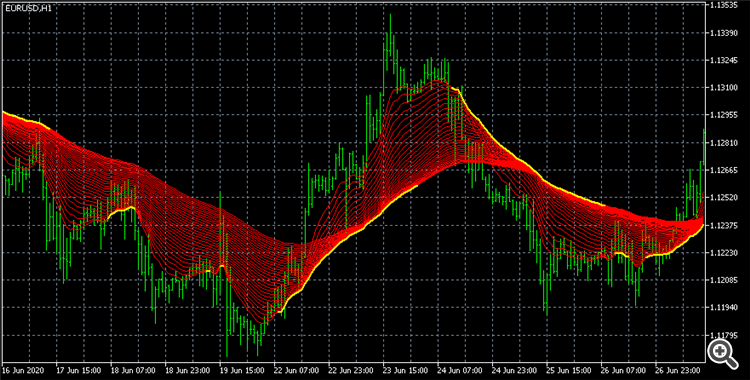
What does a harness consist of?
please put a screenshot of the whole thing.
it is desirable that you specify the feed on the screenshot to be made from the template that is in the trailer
i also looked at your profile, you have some experience
the template will answer the question and I think you can automate it yourself without difficulty
somewhere in another thread (where your question was originally) I gave you 2 times the answer... I will not copy it - find it yourself
I've tried recalculating MA repetitions by price, by period.
I did the following:
- determined the moment of each MA transition from one direction to another - signal1
- after receiving the data, count the number of repetitions of signal1 in a bar
but the result turned out to be too noisy
then I detected that the MA of the current bar have a decreasing period on the next bar, i.e. the bundle was shifted down by period
I started to connect the data in a chain to the signal1 and in the obtained data I found the moment of the transition
But it does not work all the same, sometimes it is noisy and sometimes it does not show up.
What does the harness consist of?
screenshot
it is desirable that you specify the feed on the screen, which will be made from the template, which is in the trailer
i also looked at your profile, you have some experience
The template will answer your question and I think you can automate it yourself without difficulty
Crap, the template doesn't work, the top window is blank.
Ideally the task is to get the values marked with a blue marker
I've tried recalculating MA repetitions by price, by period.
I did the following:
- determined the moment of each MA transition from one direction to another - signal1
- after receiving the data, count the number of repetitions of signal1 in a bar
but the result turned out to be too noisy
then I detected that the MA of the current bar have a decreasing period on the next bar, i.e. the bundle was shifted down by period
I started to connect the data in a chain to the signal1 and in the obtained data I found the moment of the transition
But it does not work all the same, it makes some noise or does not show.
Shit, the pattern does not work, the top window is empty
I hope you are familiar with MA formulas and their properties?
For fun, you can move each waveform half-period backwards (for sma) and watch for a couple of hours. It will make it clearer how to look for "harnesses".
I hope you are familiar with MA formulas and their properties?
For fun, you can move each waveform half a period backwards (for sma) and contemplate for a couple of hours. It will make it clearer how to look for "harnesses".
For now... I don't get your point. ( Something to do with the formula apparently.)
I only understand that I can only get a result with the flappers fixed.
And I don't think the harnesses will change their position. It's just that I'd have to go to a lot of trouble reworking the pattern to move it.Until... I don't understand your meaning. ( Something to do with the formula apparently ).
I only understand that I can only get a result with the machinations fixed.
damn it, you move them and see what happens
or do you want a ready solution? :-)
You have to start somewhere. Then try different options, additional checks.
Collect all ma in an array, sort, calculate the difference between neighbouring ma, smooth it out, find peaks and troughs.
I'm too lazy to invent any more. There is some hint that, in principle, the problem is solvable.
- Free trading apps
- Over 8,000 signals for copying
- Economic news for exploring financial markets
You agree to website policy and terms of use


Hello all!
We have an array of values - 500 Moving Averages for each bar
How can we calculate the resulting harnesses?:
- When changing direction ?
Maybe you know where to swim !
I was advised to dive into Kohonen Maps, well I haven't figured it out !