Dynamic periods for indicators
The grain is there, but a suitable mill is needed.
The idea is not new, search the codebase and the forum. Also in the indicators supplied with MT5.
// The clever name "adaptive digital filters" basically means the same thing. More precisely, it generalizes the idea a bit.
Очень много индикаторов используют для рассчета своих значений так называемый "период". Обычно это количество баров которое учавствует в расчете очередного значения. Возьмем например RSI. Если очень грубо - этот индикатор показывает отношение длинны "пробега" цены вверх по отношению к аналогичной длине пробега цены вниз. При очень маленьких периодах получается жуткая болтанка, при очень длинных - нечто слабопульсирующее около нуля. Однако рынок не всегда равномерен. Точнее всегда не равномерен. После выхода новостей смены торговых сессий да еще на коротких таймах, чтобы поймать все движения период нужно выбирать не очень большой. С другой стороны во время длинного "затяжного" тренда (или флэта) этот период вполне разумно увеличить чтобы отслеживать тенденцию самого тренда, а не колебаний внутри его канала.
Кто нибудь пробовал строить индикаторы которые сами адаптируют длину периода под меняющиеся условия? Вот, например "здесь", когда какойто другой индикатор (или какието вычисления внутри текущего индикатора) в таком то диапазоне мы пропорционально сокращаем длинну перода для этого бара, а при таких то условиях (уже на другом баре) - наоборот увеличиваем.
Если да - то какие получались результаты? да и вообще - есть ли здравое зерно в этой идее (автоподстройки длинны периода)?
I've tried this through correlation with reference harmonics,
But it turns out that sometimes periods jump sharply and then return to the initial one, thus spoiling the whole picture,
And besides this method is very long, if in realtime it can still be used in the tester, but in the optimization it is a total failure,
Well, in general, it is a promising topic.
Очень много индикаторов используют для рассчета своих значений так называемый "период". Обычно это количество баров которое учавствует в расчете очередного значения. Возьмем например RSI. Если очень грубо - этот индикатор показывает отношение длинны "пробега" цены вверх по отношению к аналогичной длине пробега цены вниз. При очень маленьких периодах получается жуткая болтанка, при очень длинных - нечто слабопульсирующее около нуля. Однако рынок не всегда равномерен. Точнее всегда не равномерен. После выхода новостей смены торговых сессий да еще на коротких таймах, чтобы поймать все движения период нужно выбирать не очень большой. С другой стороны во время длинного "затяжного" тренда (или флэта) этот период вполне разумно увеличить чтобы отслеживать тенденцию самого тренда, а не колебаний внутри его канала.
Кто нибудь пробовал строить индикаторы которые сами адаптируют длину периода под меняющиеся условия? Вот, например "здесь", когда какойто другой индикатор (или какието вычисления внутри текущего индикатора) в таком то диапазоне мы пропорционально сокращаем длинну перода для этого бара, а при таких то условиях (уже на другом баре) - наоборот увеличиваем.
Если да - то какие получались результаты? да и вообще - есть ли здравое зерно в этой идее (автоподстройки длинны периода)?
Yes, I have. Many times and in different ways. The result certainly improves (for standard applications), but it is still - as I have already written several times - a fitting of a phrase pair on an octopus, since the BP, and not a series of pulses, is considered. For example, a very simple method (apart from what I have already presented in the code base): if the amplitude of the bar is less than a specified threshold, then the period of the indicator is increased by 1. I.e. the sample length will be equal to the length of the segment, in which the significant (with amplitude greater than the threshold) bars are found. Conditions, of course, can be invented (logically, of course) in a variety of ways.
For example, the RSI for this elementary selection will look like that: they select bars with a swing greater than 2 pips (the period increases until the necessary min is reached; the period is limited at the top by a given parameter - here from 14 to 33 (blue - normal RSI, red - with the threshold). The window below shows how the period has changed.
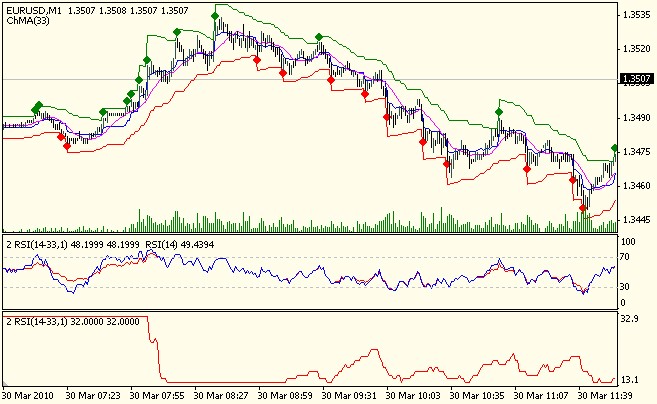
Do not look at the 0th window - it just did not erase the indicator. It has nothing to do with it. // ))) although period adaptation by EMA coefficient is used there too.
Yes. But - I repeat - it is better than nothing, but ...)))
By the way, in case you didn't know, there is the so-called DMI (Dynamic Momentum Index), where the RSI period also changes, but depending on the RMS. You can see the description in Williams and Chand.
===
And the simple approach I described can be applied to anything, where there is a sampling length. If you need something more complex, there is a special steering indicator - MsterSlave (see in the base).
===========
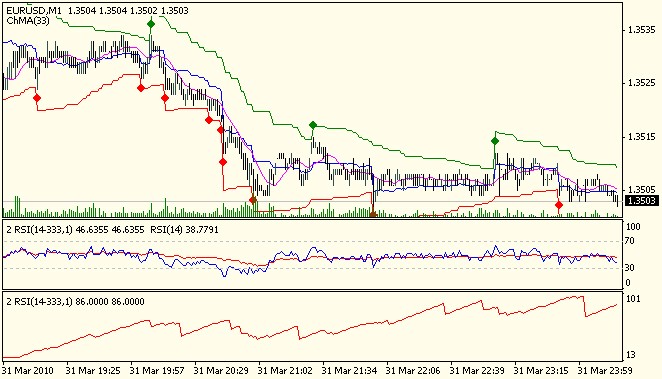
And here, where the upper limit of period length is practically unlimited. I.e. period of RSI will be increasing until it reaches 14 bars with more than 2 pips spread. As you can see, as a rule, 100 bars for a given instrument and timeframe is enough for that - in other words, the period does not go beyond 100 bars.
But replacing one uncertainty with another does not seem to give a qualitative result. damn, almost a philosophy, mother of all sciences.
Thanks to everyone who responded - I'll try to digest it, think about it and come up with something.
A period-adaptive indicator is a transfer of a part of the system and the trading idea into its code. I.e. timing depends not on the indicator, but on the trading idea, and the indicator is just a transformation of the price.
TA tries to identify the objectively occurring processes in the market and allow to use them while they still exist. I.e. the initial process, and the events on the chart are the opportunity to detect in what phase it is in. In this way, for the adaptivity it is not necessary to calculate the value of the period, but the new reference points. I.e. there is a certain TA event (breakthrough, impulse, etc., etc.) - there is a new point in time from which the reference is made. In fact it is a new t-stop. The indicator is counted on the adaptive window with a period equal to the shift of the current time moment from the reference t-case. If a new datum is identified, the period is calculated from it. But maybe the variant is useful, when at appearance of new TA event the period of indicator becomes some default value, that actually means the capture of price of forming of this event. Or to calculate the period of indicator use the time between nearest TA events
I decided to join in the conversation amongst the scientists and contribute my own cooking recipe. For the last couple of years I have been making almost all indicators with adaptively changing parameters. Primitive solutions do not work in the market, I came to this conclusion long time ago, and I have been nurturing the idea to make a fully adaptive system, but I have not got time to do it yet, I make separate adaptation fragments in indicators. Here is an example of a fragment of the latest indicator. In general, the indicator consists of several functional blocks, each block forming its target signals, all in all there are 24 signals, I will only cite one block that forms channels. I have not made autotuning for the change of timeframes and symbols yet, therefore each variant should be adjusted individually.
//=====================================================================================================================================
extern int PIB= 33;
extern int PIS= 37;
extern double PMB= 3.98;
extern double PMS= 3.98;
//====================================================================================================================================

//+------------------------------------------------------------------+
//| expert initialization function                                   |
//+------------------------------------------------------------------+
int init() {

        PPB=NormalizeDouble(PIB*Point,Digits);
        PPS=NormalizeDouble(PIS*Point,Digits);
        PMB=NormalizeDouble(PMB*Point,Digits);
        PMS=NormalizeDouble(PMS*Point,Digits);
           }
expert start function :
     PR=NormalizeDouble((High[1]-Low[1])+(High[2]-Low[2])+(High[3]-Low[3])+(High[4]-Low[4])+(High[5]-Low[5])+(High[6]-Low[6])+(High[7]-Low[7]),Digits);
     PRB=NormalizeDouble(PMB/PR,Digits);
     PRS=NormalizeDouble(PMS/PR,Digits);

      BTH[0]=High[0]-PR/17-PRB/2;
  if ((MathAbs(BTH[0]-BTH[1])<=PPB))
      BTH[0]=BTH[1];

      BTC[0]=Close[0]-PR/10;
  if ((MathAbs(BTC[0]-BTC[1])<=PPB))
      BTC[0]=BTC[1];

      BTC[0]=0.4*BTC[0]+0.6*BTC[1];

      BTL[0]=Low[0]-PR/17+PRB/2;
  if ((MathAbs(BTL[0]-BTL[1])<=PPB))
      BTL[0]=BTL[1];

      STH[0]=High[0]+PR/17-PRS/2;
  if ((MathAbs(STH[0]-STH[1])<=PPS))
      STH[0]=STH[1];

      STC[0]=Close[0]+PR/10;
  if ((MathAbs(STC[0]-STC[1])<=PPS))
      STC[0]=STC[1];

      STC[0]=0.4*STC[0]+0.6*STC[1];

      STL[0]=Low[0]+PR/17+PRS/2;
  if ((MathAbs(STL[0]-STL[1])<=PPS))
      STL[0]=STL[1];
As you can see, parameters of the channels are adaptively adjusted depending on average dynamic indicators of the last several bars.
The result is the following picture:
VTN - blue, BTL - yellow, BTL - pink, STH - blue, STC - red, STL - purple;
Of course, this is a simplified approach, for more accurate adaptation to the changing market phases we need a more complex solution, but nevertheless this variant significantly improves the characteristics of the indicator.
- Free trading apps
- Over 8,000 signals for copying
- Economic news for exploring financial markets
You agree to website policy and terms of use
Has anyone tried to build indicators that adapt the period length to changing conditions? For example, "here", when another indicator (or some calculations inside the current indicator) in such a range, we proportionally decrease the period length for this bar, and in such conditions (on another bar) - vice versa.
If yes - what results were obtained? And in general - is there a common sense in this idea (autotuning of the period length)?