I dont know if this against the rules...
The Second System:
1-2-3-4 Forex Reversal Trading Strategy
A 1-2-3-4 reversal chart pattern is build up of 4 definable points,
known as point 1, 2 , 3 and 4.
A typical 1-2-3-4 chart pattern is best traded after a strong currency pair up
- or downtrend and can be defined by an easy set of trading rules.
A trader can confirm the reversal trade using
a technical indicator such as DMI or MACD.
1-2-3-4 Basic Rules for Short Trades
Point (1): The high in an up trending currency market.
Point (2): A downward correction in the up trend,
the lowest bar in the correction before the price moves back up to point (3).
Point (3): The high in the move up from Point (2)
but a failure to make a new higher high(Point 1).
Point (4): Go short 1 pip below point (2)
1-2-3-4 Basic Rules for Long Trades
The reverse is true when applying these basic rules for long trades but now:
Point (1): The low in a down trending currency market.
Point (2): An upward correction in the downtrend,
the highest bar in the correction before the price falls back up point (3).
Point (3): The low in the move down from Point (2)
but a failure to make a new lower low(Point 1).
Point (4): Go long 1 pip above point (2)
1-2-3-4 Up Forex Reversal Strategy using MACD
1) Trade this reversal pattern only after a strong downtrend
2) Place points (1),(2) and (3) on your chart
3) Place a BUY order 1 pip above (2)
4) Confirm the trade using the MACD indicator (or another);
the MACD must signal a buy or in buy mode already.
5) Target level: Calculate the distance between (2) and (3);
if for example the distance between (2) and (3) is 50 pips,
than 50 pips is your target level.
6) Place your stop 1 pip below (3)
1-2-3-4 Down Forex Reversal Strategy Using DMI
1) Trade this reversal pattern only after a strong up trend
2) Place points (1),(2) and (3) on your chart
3) Place a SELL order 1 pip below (2)
4) Confirm the trade using the DMI indicator (or another);
DMI must signal a sell or in sell mode already.
5) Target level: Calculate the distance between (2) and (3);
if for example the distance between (2) and (3) is 250 pips,
than 250 pips is your target level.
6) Place your stop 1 pip above (3)
The Third System:
3 ducks system by Andy Peter
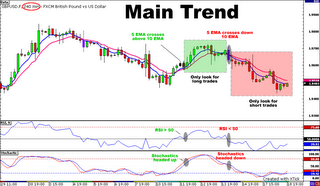
Firstly I would like to say, I did not reinvent the wheel with this system, I have just added one or two ideas to a 60 period simple moving average (sma) to make it my own and named it "The 3 Duck's Trading System" for obvious reasons as you will find out later on. The system is fairly straight forward and easy to use. Like a lot of trading systems it will be more productive when prices are moving in one direction and not stuck in a tight trading range. Of course this system has losing trade and losing runs, but with proper money management and good discipline I'm sure this system will keep you out of bad trades and give you a great chance to make profits in the Fx market. One of the nice things about this system is it will quickly tell you if prices are in an up or down swing phase and stop you from guessing! It will also allow you to decide to be a bull or a bear and trade in the direction of that trend. There are 3 charts involved in this system: a 4hr chart, a 1hr chart and a 5min chart. There is 1 indicator, a 60 period simple moving average (60 sma) plotted on each chart. There you go, its that simple.
How it works:
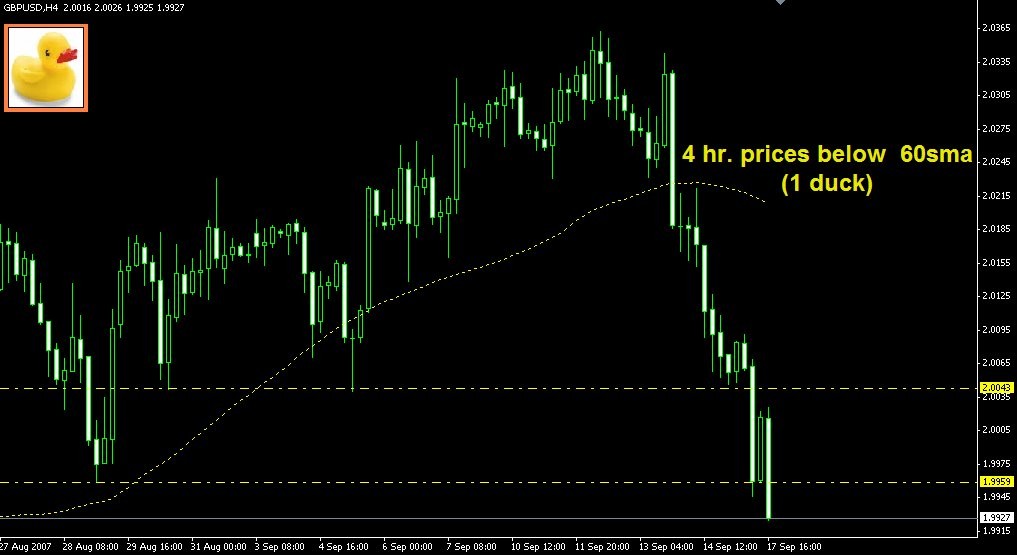
Step 1 - First Duck
The first thing we need to do is look at our largest time-frame (4hr chart) and see if current prices are above or below the 60 sma. From this chart we can see that current price is below the 60 sma. This tells us that we maybe looking to sell.
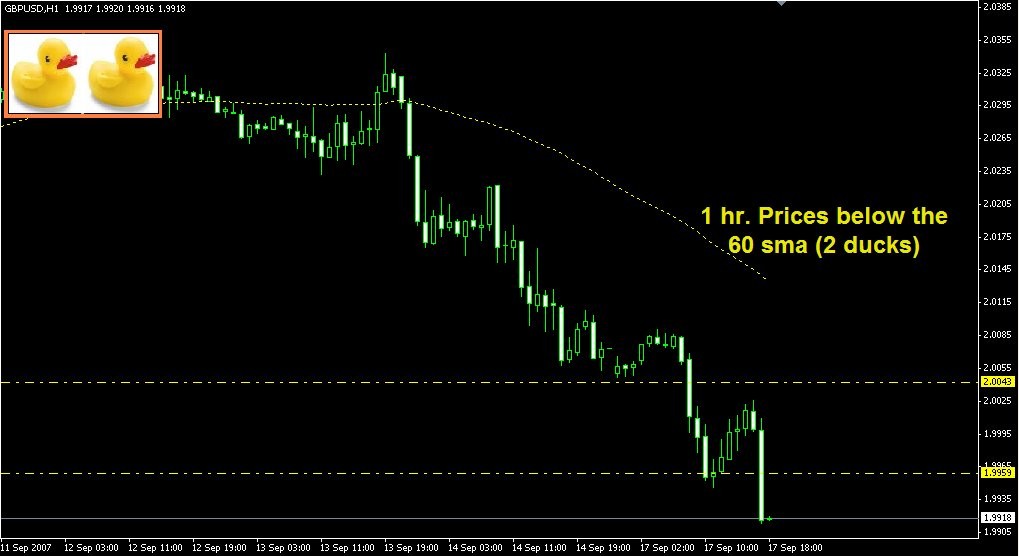
Step 2- Second Duck
The second thing we need to do is drop down to our 1hr chart. We need to see the current price below the 60 sma on this chart also, this gives us confirmation.
Important: If the current price was to be above the 60 sma on this chart we could not move on to step 3.
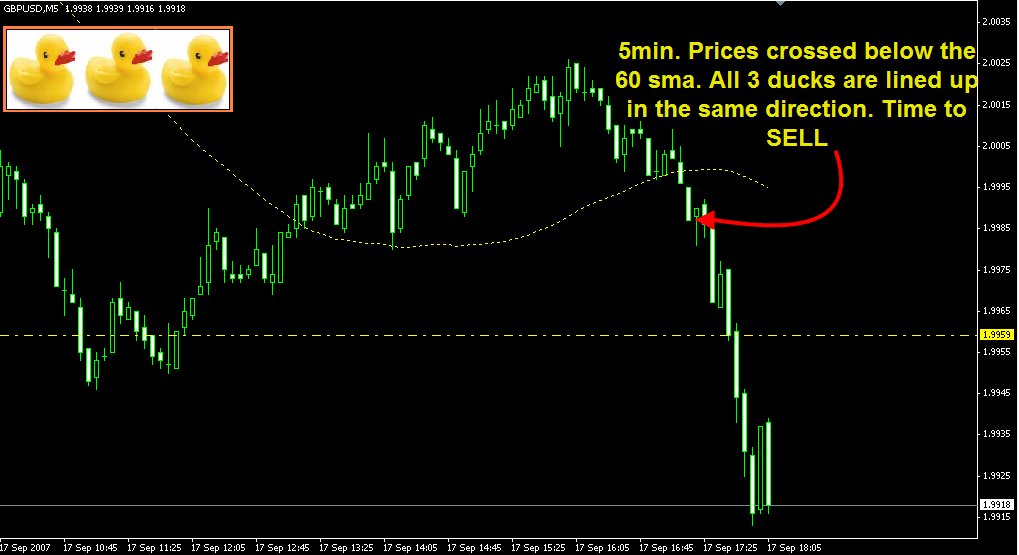
Step 3 - Third Duck
From step 1 and 2, current prices need to be below their 60 sma's on each chart. We are now on the 5 min chart and we are looking to sell when price crosses below the 60 sma. For extra confirmation we should let prices break the last low on the 5 min chart. This would mean that prices will be below their 60 sma on all 3 time-frames, therefore all 3 Ducks are lined up in the same direction.
Stop-Losses: This is where you can make this system your own. If you are a short term trader you may want to put your stop-loss above the highs on the 5 min or the 1 hr chart. If you are more of a positional trader you may wish to put your stop-loss above a high on the 4 hr chart. You could also use a fixed stop-loss, maybe 25-30 pips or more from entry. It all depends what type of a trader you are, so you decide! If you are a longer term trader or investor, this system can help you get a good entry point into the market. Another "trick" that may help you preserve capital, If you do sell and prices get back above the 5 min 60 sma by 10 pips (not a good sign) you may want to cut your losses short before your stop-loss. But if you are a longer term trader this may not be a big deal for you.
Targets: Same again, depends what type of a trader you are but target can be support or resistance levels.
Summary: The above example was carried out when the gbp/usd was trading lower so obviously we where selling - the system works just as well for buying opportunities, just look for prices to be above the 60 sma on all 3 time-frames, starting with step 1 again. I like this system a lot as it does not try to out-guess the markets movements and pick tops and bottoms. The system will quickly tell you to be a buyer or a seller. Its a good honest system that tries to follow prices. This system works better on currency pairs such as the Eur/Usd and Gbp/Usd, but there is nothing stopping you from plotting this system on any pair, but as we know some pairs act differently to others. The best time I found for trading this system is the European and US sessions. I lke to use this system as a guide in addition to my own market knowledge. Take care to watch what is going on around you - economic new releases, holidays etc.
The Fifth System:
Carry : Trade Strategy
Betty Samang
The carry trade, which involves going long a high-yielding currency against a low-yielding one is very popular among long term currency traders. Nowadays, carry traders love the yen crosses due to the very low JPY interest rate, for example, the GBP/JPY or NZD/JPY cross currency pairs. Carry trades are typically held for several month or even years. Currently, when holding a long position in the GPB/JPY pair, forex brokers will pay out over $23 a day per 100,000 units in interest.
Now, when you think about building a carry trade, you should not think in the same terms as you normally think when you trade forex. You have to use much lower leverage, and you have to become a lot more conservative since you are planning to keep the trade for a longer time period. A carry trade can be an amazing opportunity to generate very good passive income ...similar to a real estate investment.
Daily rollover interest debit/credit Formula
Number of lots (Units) x (base currency interest rate - quote currency interest rate) / 365 days per year x current base currency rate = daily rollover interest debit/credit GBP/JPY Carry Trade Example
Because UK has 5.25% rate, and Japan has 0.25% rate, this cross is very attractive for carry traders looking for buy opportunities only since they want to earn daily interest on the open position. Preferred timeframe's to make trading decisions are daily and weekly charts because they are looking to keep the trade for a longer time period. It really makes no sense to study a 5 min chart to take a carry trade.
A very simple strategy is the moving average cross over, looking to the above example, we only go long when the 5EMA crosses the 200SMA from below (up trend) but we do not take trades when the 5EMA crosses the 200SMA from above (down trend) because the carry trade strategy would focus only on interest-positive trades: in the case of the GBP/JPY, long trades.
When you are long GBP/JPY, most forex brokers will pay out over $23 a day per 100,000 units in interest which is paid on a daily basis. If for example, you keep the trade for 200 days, this would bring an amazing $4600* interest credited to your account not including the pips you lose or gain.
* The above calculation is an example only and is to be used for educational and informative purposes only since the amount actually debited or credited to your account will vary depending on the forex broker. Most brokers display the daily rollover interest fees on their online trading platform.
Carry Trade Strategy
Identify a pair like GPB/JPY with a high interest differential
Apply Technical Analysis and create a rule-based trading strategy using longer term timeframe's only
Only long the currency bearing the higher interest rate: in the case of the GBP/JPY, long trades
Keep an eye on the interest rate differential because it can vary over time
Another strategy is to open inversely correlated positions that are both interest-positive. This way, any losses in one currency's price would be (roughly) offset by gains in the other, while both earned interest. This is the idea behind a balanced basket of interest-earning currencies.
Interesting Carry Trade Pairs
All pairs that include the Yen due to the very low JPY interest rate
Hi limestreamx, it is nice to see generous people like you.
But does it better to discuss every system on a separate thread? that will keep the attention focus.
Just a suggestion 
Hi limestreamx, it is nice to see generous people like you.
But does it better to discuss every system on a separate thread? that will keep the attention focus.
Just a suggestion thanks for u suggestion devil but i like to compile it here... so everybody can come, read and try it... juz a few more system i would like to post... then in future if i have a new system i will post it separately... 
The Sixth System:
200 EMA Forex Strategy - Easy For Beginners
By Michael A Jones
Are you a relatively new trader looking for a solid forex strategy?
A challenge facing many new traders when developing their forex strategy is the ability to identify
the overall trend for intra-day trading.
The 200 EMA (Exponential Moving Average) can solve the problem.
The 200 EMA is one of the most popular indicators of all time with Forex traders the world over,
and for that reason alone is worth noting due to the psychological effect on the market place price can have when hovering around the 200 EMA.
Using The 200EMA Strategy
To use this very powerful Forex strategy, create charts on 3 time frames:
4 hour
1 hour
15 minute
Now plot a 200 EMA indicator on each chart and, as a suggestion, color it red, for easy visual impact.
Preferably tile the 3 windows containing your 3 charts into a vertical fashion so you can see the 3 time frames next to each other. It will squeeze up the information on the charts somewhat but for the purpose of this strategy that doesn't matter.
Now scroll through the various currency pairs you like to trade.
If you prefer to trade only pairs with a smaller pip spread, they amount to about 9.
They are:
EUR/USD
GBP/USD
USD/CHF
USD/JPY
EUR/JPY
USD/CAD
AUD/USD
NZD/USD
EUR/CHF
What you are looking for is any currency pair that bucks the 200 EMA on the 15 minute chart.
So for example, look at the EUR/USD pair and note the position of price relative to the 200 EMA
on the 3 time frames.
If price is well above the 200 EMA on the 4 hour chart, well above the 200 EMA on the 1 hour chart, but BELOW the 200 EMA on the 15 minute chart, price is bucking the trend.
The overall trend is up, price has temporarily gone against the trend and is currently in a retracement.
Using the fundamental trading principle of "buy the dips in an uptrend", "sell the rallies in a downtrend", look for a suitable entry point.
In the example given above you would look for an opportunity to buy the EUR/USD, perhaps watching for a candle signal that price has exhausted it's downward momentum, bucking the 15 minute chart 200 EMA and will soon resume it's upward momentum.
This is an easy exercise and it can be done once or twice a day, taking just a few minutes.
Watch For Price Bucking The Trend
Once you see price bucking the 200 EMA on the 15 minute chart, whereas it is on the opposite side
on the 4 hour and 1 hour charts, sit up and take note. Watch carefully and grab the opportunity to get in and make some pips.
After a little practice you will see how extremely powerful this simple Forex strategy is - certainly deserving a place in your trading tool kit.
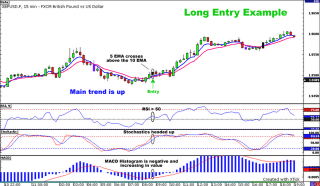
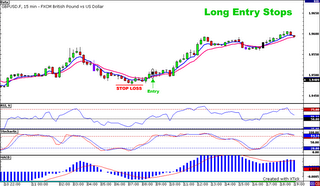
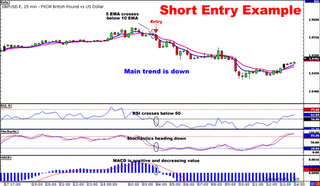
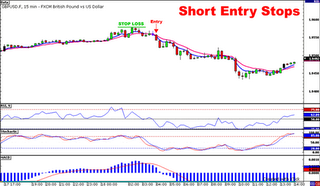
BOGOVINO SYSTEM :
Here it goes... It's quite simple. On a 1 Hr chart, plot 5/12 EMA's. Plot RSI set at 21. When the 5/12 crosses up and the 21 RSI crosses above 50 you go long. When the 5/12 crosses down and the 21 RSI goes below 50 you short.
This method is proven to be at least 85% accurate!
EMA's on close.... Entry on the 5/12 cross with the 21 RSI above (Long) or below (Short) for entry. Exits on Fibs.... I draw the fibs on the charts, but Renasdad had a 1hr Vegas tunnel indicator which I hopes he posts for you all to use as entries and exits on trades.
I leave this thread open to any and all improvements. I thank you for your time and I hope this helps you all become more successful traders!!!
- Free trading apps
- Over 8,000 signals for copying
- Economic news for exploring financial markets
You agree to website policy and terms of use
Hi to all dear traders... i have been collecting some trading systems in the past few month in this forum and else where... so i think i wanna share it here with u all. at least this is my contribution to this beloved forum of ours... i will post it here one by one. some usefull e books also... i hope the administrator wont banned me for this...
before i started i wanna share a few trading rules that ive read and come to sense that whatever trading system u are using this is the main rules...
i dont remember where i got it and the author.. so read on.. these are the main rules. These rules are to be followed to the letter. Ignore them at your own peril:
Rules summary