
Example of making a trading strategy with Pattern Explorer ©
Pattern No1 - Rails
Let's try to make a trading strategy on base of the first pattern. Choose the pattern in the adviser settings, in «PATTERN SETTINGS» item. Set the value 1 in Pattern variable.
Now we should appraise: do we have any advances entering the deal by this pattern's signal on chosen trading instrument and time frame. We talk about direct using of the pattern, without any additional entrance conditions and combinations of stop losses and take profits. Practice shows, that if pattern gives absolutely negative result in the context of this kind of testing, it is impossible to normalize the situation by adding different conditions.
There are a lot of ways of making trading strategies. Now we will try to start picking a trading instrument under a pattern. The first candidate will be EUR/USD currency pair – the most useable and top ranking index: [volatility]/[spread], pair.
Thus, we've chosen a pattern and an instrument. We will set a base timeframe – D1 (TimeFrame-1440), but for the first test we also should set two base conditions, without this conditions the test has no sense, this conditions are stop loss and take profit. For the “test integrity” we suggest you to set the same TP and SL value for easier appraisement. This way will show your chances for getting profit.
We may choose the equal TP and SL, value in a stated points numbers, but we prefer TP and SL, value in a stated percentage from average daily range (ATR), it allows us to equal the situation for patterns, which meet in different history years (for example, volatility of an instrument in 2015 and 2005 years may be absolutely different, in case of SL, value in stated item points, SL in 2015 and 2005 will be different).
For choosing SL and TP in percentage from ATR regime, we should set Mode=1 in «STOP-LOSS SETTINGS» item and TP_Mode=1 in «TAKEPROFIT SETTINGS» item. Set necessary value of calculated percentage from average daily ranges (ATR) for SL and TP, in ATR_percent variable and TP_ATR_percent in relevant items. In our case let the value be 150 (%), both for SL and TP. Do not forget to turn off «Bailout» regime (we do not need it now), set “false” in a relevant setting.
As soon as we assure that there are no additional conditions, we suggest to make the first try-out test. In tester settings choose “period” - M5 “open bar” regime. We use the adviser for D1(TimeFrame-1440) time frame, chosen “period” - M5 setting will not change it. It will give a task for a tester to make necessary daily candles from existing “five minutes”.
This way allows us to increase testing speed in ten times without losses, rather than “period” - D1 regime “All ticks”. That is what we need for primary tests or criteria optimization. Set history test period. We use “daily chart”, so we take at least 5-7 years. For example 2008-2016. Start the test!
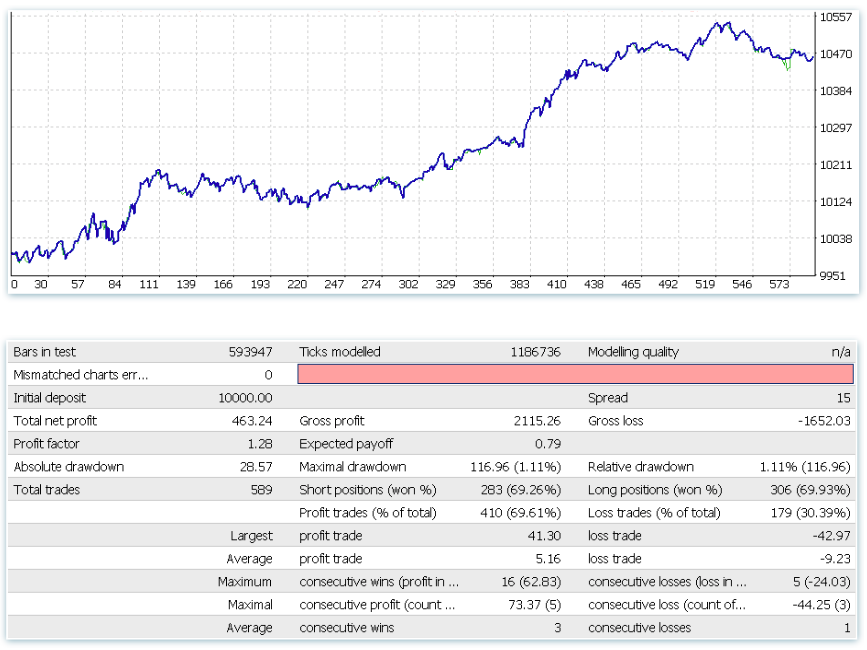
Thus, during last eight years we have next situation:
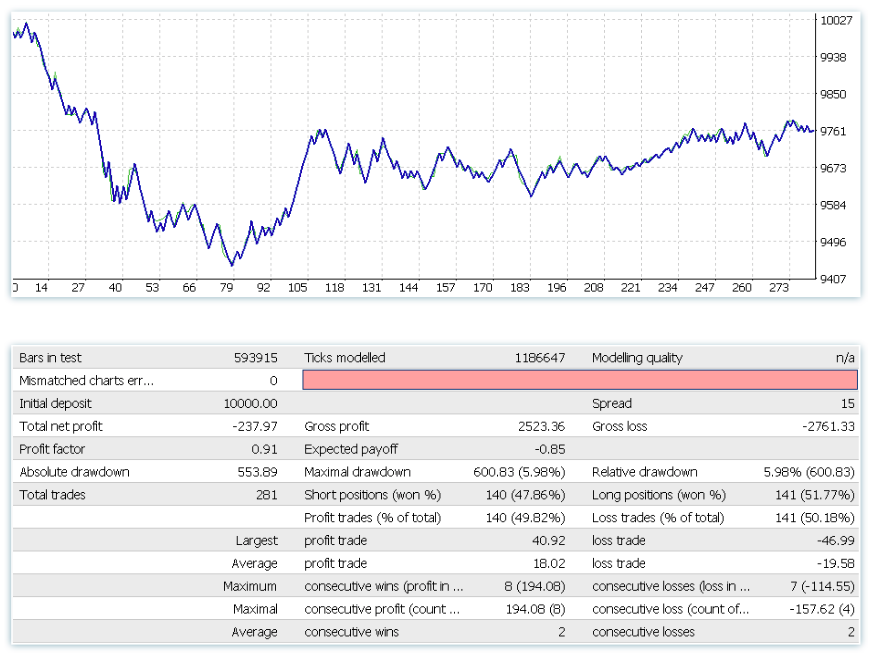
281 deals, 49% un-profitable, conclusive result -237.97$. Temporary drawdown came to -600$. Pitty, isn't it? Not really. In spite of negative result, dynamics is almost positive on the last 2/3 intervals. Let's see what increasing of deals number by setting Accuracy in a less strict regime will give us. 281 deals in 8 years on daily diagram – it is not little, 3 deals in a month for D1 is normal, but anyway let's try. Accuracy was automatically = 50. Let's put = 20.
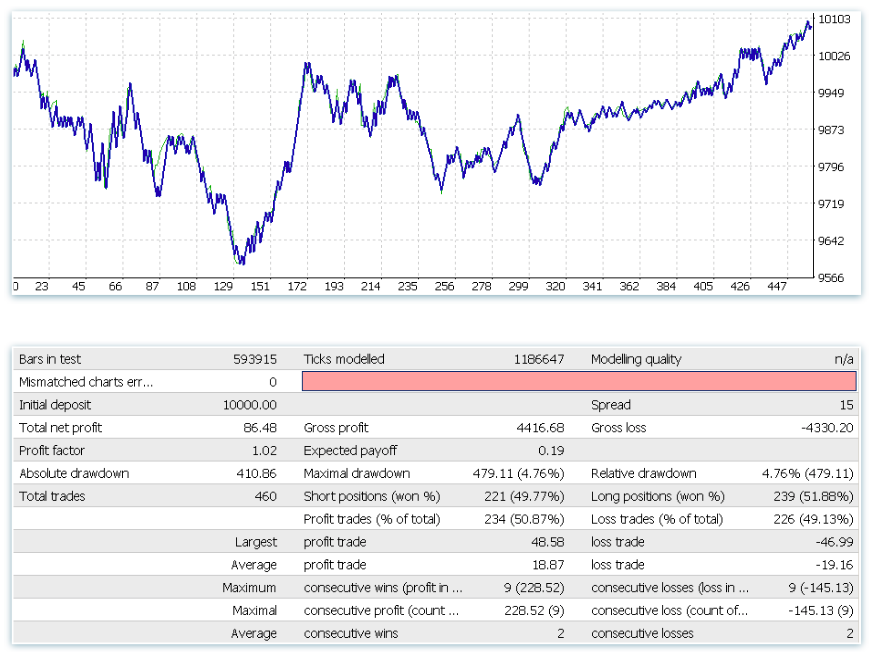
Already better, more deals -460, profit percentage 50.87%, but still that is not what we are looking for. Have no system making experience trader may have a next comment: “seems that the adviser defines Rails pattern not correctly, as it is well-known that Rails pattern is operational!” He does not know that “operational” in trading topic blog and operational in reality are two different things.
Partly, this trader is right, because it is seldom when someone recommends to use the pattern “bluntly”, usually recommends to refer with another market reality, for example: trend, contr-trend etc. Thus, we should continue researching of Rails pattern workability on EUR/USD D1 – we may add and combine conditions.
Let's delay EUR/USD to show the result of using the same pattern on different trading instruments (it contradict to a general notion about pattern “universalism”)
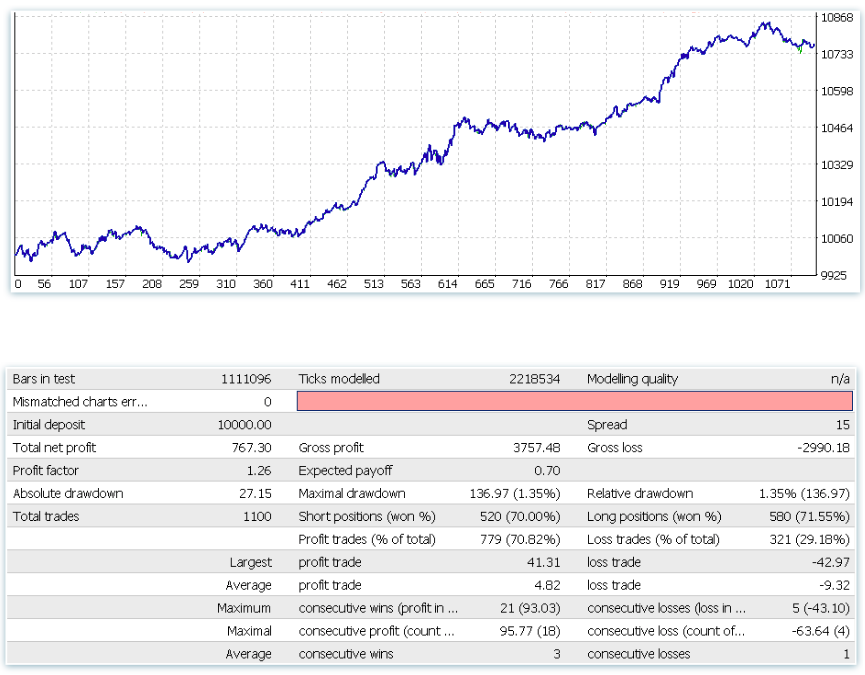
Try USD/JPY. Stay the last settings.
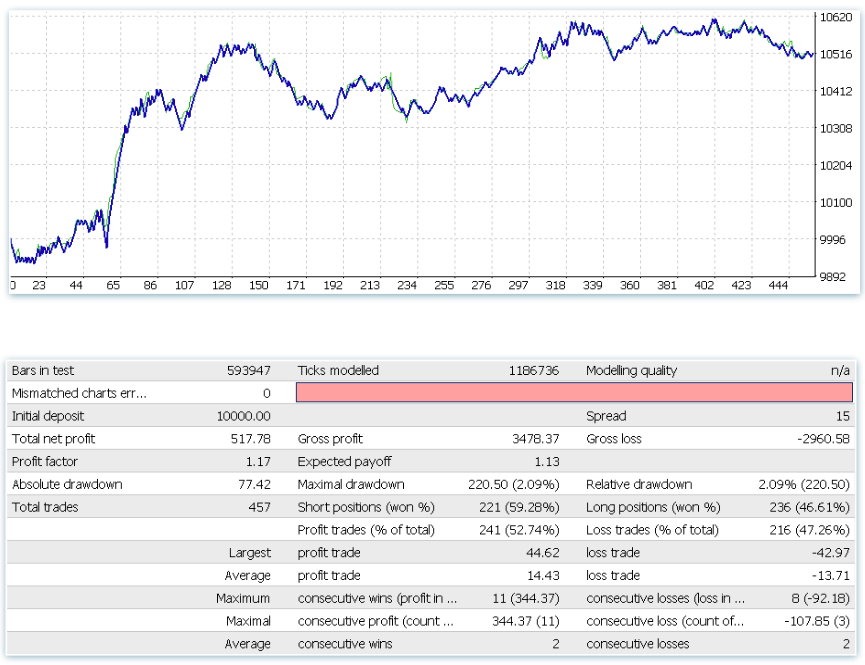
Much better! This result provokes on more detailed analysis, obviously that entering by Rails signal on USD/JPY D1 we have some statistical advantage. Let's try to increase it. Instead of sorting TP and SL sizes and using TP, we will try to use “Bailout” technics, which was developed by mathematician Ralph Willis. Relevant setting = true. Turn off TP: TP_mode=0. SL – leave former.
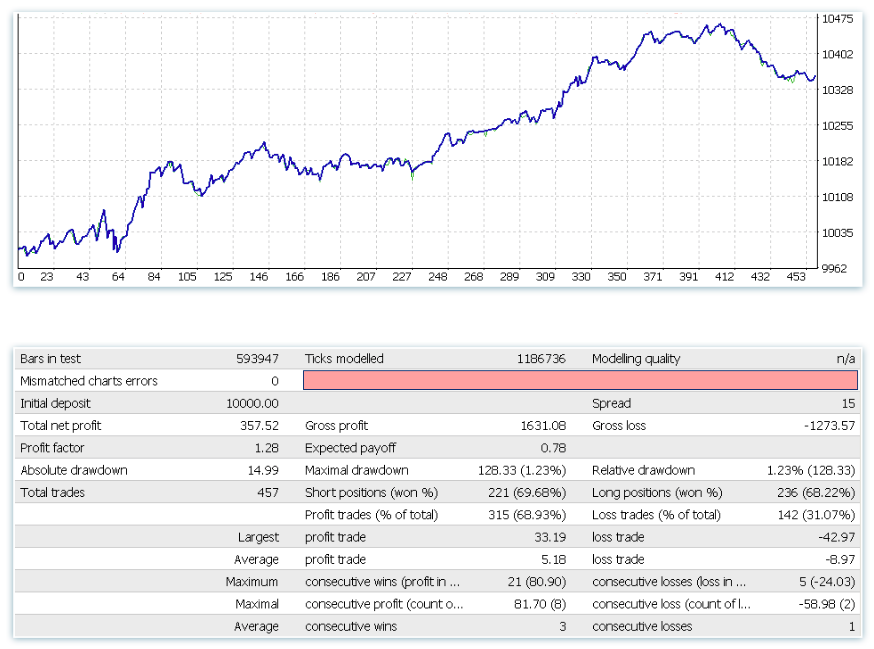
So, the result is obvious! Money result (with allowance for drawdown value) is not dramatically better, but we've achieved more smooth upleg, that is very well. Let's try to “play” with Accuracy value, put optimization [ from 1 till 100 with step 2] and see how claims on pattern influence on result. Finding out, that the best results achieve when we set the minimal claims on pattern – it is unusual, but meets quite often. In this case, Accuracy = 1 gives the next result:
More deals, more profit, less drawdown. At that, we sill did not add any extra conditions and did not set optimal exits, but pattern already shows the result. This fact inspires careful optimism. But before improving system's indexes, we should do one important thing. Let's make Out-of-sample test. Check the adviser on that part of history, which we did not use during criteria optimization process (always leave this kind of).
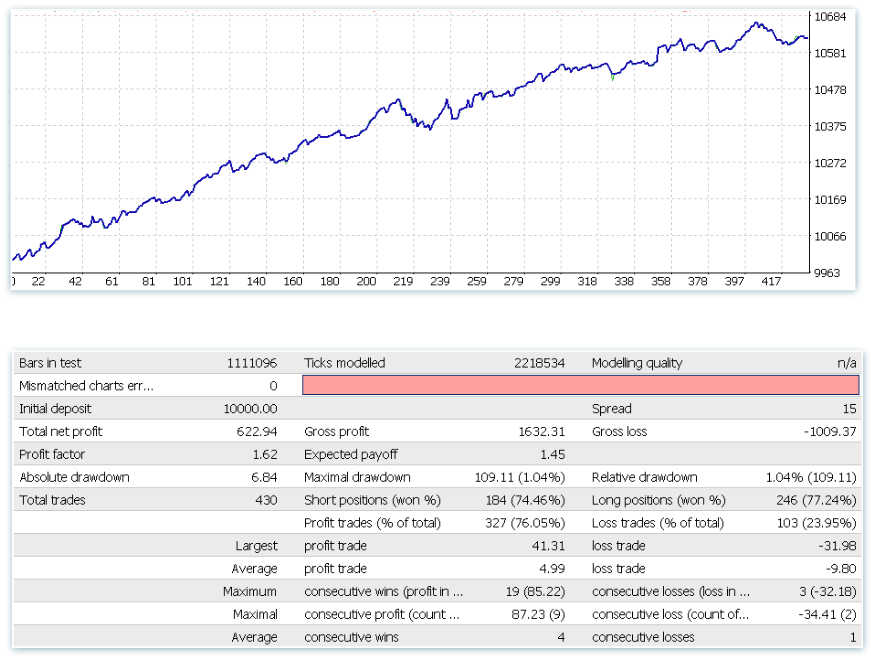
Leave a former settings and make 2001-2016 test.
As you can see, we are lucky. Pattern is really stable on a long history interval. We may continue trying for result improving.
Let's try to trade pattern only according to trend determined with moving average (MA). In «FILTER SETTINGS» set MA_filter_type = 1, for example MA_period is 10. If “bull” pattern forms higher than 10 days MA, we buy. If lower, we pass the deal. Conversely for short positions.
Interesting result! Visually the diagram became more beautiful, but the result according to [profit]/[maximum drawdown] criteria increased not much, 5.7 against 5.63, what should we choose? It is a debatable question. May be we should stay on a variant with large number of deals and look at detailed work of another filter, for example filter, which limits trading in stated days of week, what do you think?
Or.. is it too early for now to continue with this filter? Because we still did not set an optimal stop loss, we automatically set a value equals 150% from ATR. Is there a better variant? 200%, 250%? Should we start a trailing stop? Generally, how often does profitable deal go in a minus? What if we upon reaching stated profit set SL “in the black”?
We still did not set profit as well. Do we exit from the position too early? What if we should give a chance for price more time? Realize the potential of movement? Probably we vainly do not set a fixed TP? As soon as we find main position, we may experiment with weekday filters etc. By the way, what if drawdown of signal level for entering a deal in a pattern during dull asian and pacific sessions are usually false? At least, may be it is better not to buy, but sell under drawdown of signal level in Rails “bull” pattern? Who said that it is “bull's” one? Let's check? With the Pattern Explorer © EA this challenge is easier. Wish you successful searching!


