Technical Analysis of Gold for April 20, 2016
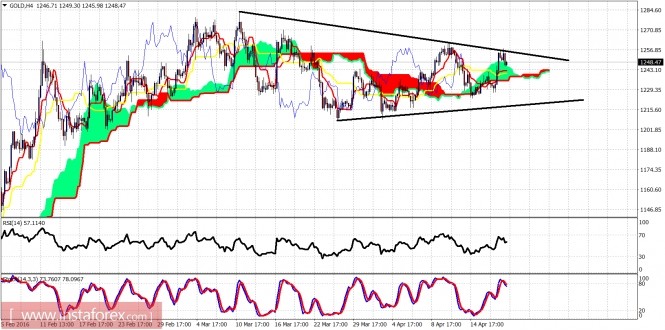
Gold bounced yesterday towards resistance of $1,260 and got rejected as the price hit the upper triangle boundary. This rejection is a bearish sign. The price remains trapped inside the triangle pattern and as long as the price is below $1,260 I prefer to be bearish or neutral.

Black lines - triangle pattern
Gold is turning lower after the rejection at the upper triangle boundary. The stochastic is turning lower from overbought levels. Support is at $1,242 and if broken we could see a move even lower towards the lower boundary of the triangle pattern.

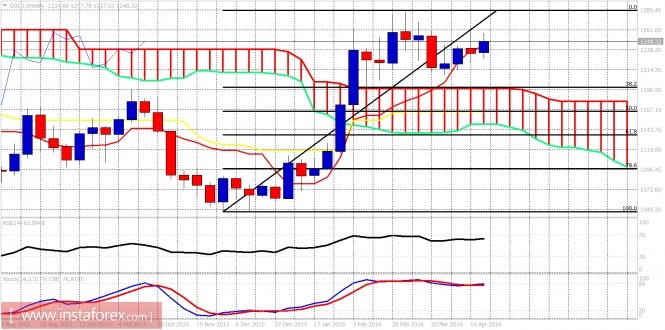
The weekly candle is trading above the tenkan-sen (red line indicator) but with the Stochastic turning lower from overbought levels, I do not see much more to the upside is left. Critical weekly and daily support at $1,240. A close below it will open the way for a move towards the 38% Fibonacci retracement which is our target for some time now.
The material has been provided by 


