Remembering veterans: Box and Jenkins
You have to start with the source
Don't link, or there will be an Econometrics 2 thread again, where almost no one really understands what you are trying to achieve. In your own words, faa!
I recently read an article that thick tails are caused by outliers, often single outliers. I recall you had a different opinion. I could be wrong though.
Getting there? From nothing to do, fighting the blatant ignorance among forumers. Don Quixote. There are plenty of people here who are proud of the fact that they do not read anything. It's just awful! And here are two links at once.
No. Only the original can be discussed. No "modern statements" are acceptable
Maybe I didn't put it accurately. The link is fully in line with the original and may be wider. But that's not the point.
Let's digress.
What is the semantics of a programming language operator? It is the program, the code that executes that operator.
What is an ARMA model? This is the code that executes that model.
If we move away from this interpretation, we are bound to drown in different interpretations by literate people and over-interpretations at the level of terms of the ignorant.
In this forum - a program (executable code) is semantics. So the semantics of Box's book is a program, like STATISTICS, that gives valuable meaning to trading formulas, words.
Let's begin.
An ARIMA model is written in the form: ARIMA (p,d,q) or AR(p) I(d) MA(q), where p and q are the number of lags in the regression equation and d is the number of times the original series was differentiated.
First we will take ARMA and select the number of lags. We will take EURUSD from 2011.11.28 00:00 to 2011.12.23 21:00. This is an integer number of weeks, each week has 118 hourly bars - all 472 bars.
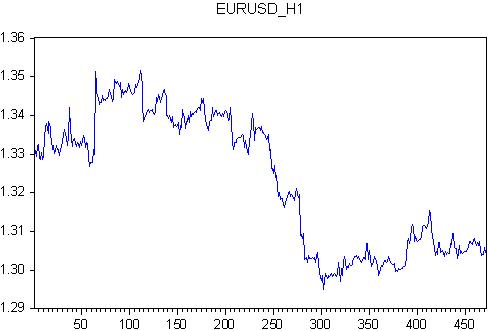
For this quote we write the regex equation
eurusd ar(1) ma(1) c @trend
i.e. we define EURUSD quotient through autoregression, error, shift (constant) and linear trend
Let's estimate coefficients of this regression.

We have got a decent result on two parameters and a flat result on the other two parameters: @trend ma(1) have very large error values when estimating coefficients.
What is the practical result of this exercise?
(1) We have got some equation, which can be programmed as an indicator with characteristics in numerical form.
(2) Our indicator takes into account only the previous value of the quotient and the difference between the quotient and the regression value. So our indicator is more accurate.
(3) Completely new result for TA: coefficients in an indicator are random variables. At least one conclusion: indicators without adaptation of coefficients to the current quote are meaningless.
.....
(2) Our indicator only takes into account the previous value of the quotient and the difference between the quotient and the regression value. So our indicator is more accurate.
(3) A completely new result for TA: the coefficients in the indicator are random variables. At least one conclusion: the indicators without adaptation of the ratio to the current quote are meaningless.
(2) More accurate than what?
(3) What good does it do if your indicator is more accurate but meaningless?
(2) More accurate than what?
(3) What's the profit in your indicator being more accurate but meaningless?
You are only interested in self-interest.
Econometrics is not for profit, but for the world crisis.
It does not matter which indicator is more accurate and it does not matter that it is meaningless. The most important thing for a nerd is to calculate everything that comes to hand. But the programmer has finally mastered EViews and is happy that he can plug some data into the program and get in return some meaningless numbers. The main thing here is not the result, but the joy of the process.
The econometrician wants us to rejoice together with him. So let us not spoil his mood with mercantilism and rejoice at the meaningless possibilities of econometrics.
Let us also honour the memory of Jenkins and Box, the instigators of the world crisis, with a minute's silence, i.e. we should try to live a whole minute without swearing at them. It won't happen immediately and not for everyone, but you have to try.
(2) More accurate than what?
(3) What is the benefit of your indicator being more accurate but meaningless?
(2) More accurate than what?
It's all in the comparison. Once wrote an article that HP has little to do with quoting. More accurate than HP, if you like.
(3) What's the benefit of your indicator being more accurate but meaningless?
And this is the cornerstone question of everything in both TA and econometrics.
The question in answer is: what should be the point?
- Free trading apps
- Over 8,000 signals for copying
- Economic news for exploring financial markets
You agree to website policy and terms of use
In 1974, 38 years ago, the legendary book "Time Series Analysis" by Box and Jenkins was published. This book has had and continues to have a huge impact on time series analysis and forecasting. To this day, US government agencies are still making forecasts using a modification of this model, although a lot of new stuff has come out. But let's remember the veterans.
The book presents the ARMA model , ARIMA in the Russian translation ARSS or ARPSS.
There are a number of misunderstandings about this model. Let's start with the name.
In Russian: ARSS - autoregressive and moving average.
AR - autoregressive - is self-explanatory. The last term of the time series is defined through its previous, lagged, values. A common idea of almost all indicators.
SS - moving average. This is where it gets tricky. It's got nothing to do with the scales. It's about noise modelling. That is, the model initially represents the market from two components: deterministic, which is described by AP, and noise, which is described by MA. For indicators this is clearly a new word since 1974!
There is an extension of the ARSS model in the form of ARPSS, where P is pro-integrated. This is where it comes in. Integrated means differentiated! That is, they took the difference between the neighbouring bars of the quotient!
And the final achievement of Box and Jenkins. The non-stationarity of BP is explicitly recognised and a methodology for converting a non-stationary time series to a stationary one is proposed. The letter "P" is just the way to transform non-stationary VR to stationary.
Further in the topic I will give the results of calculations by this model. I propose to discuss the results and applicability to Fora. The model is discussed fully enough in STATISTICS both in the documentation and in the software implementation. I will use EViews, although in this matter it seems to me to be inferior to STATISTICS.
So let's begin.