Decreasing Memory Consumption by Auxiliary Indicators
ds2 | 2 June, 2011
1. The Problem
Probably, you have already used or created Expert Advisors or indicators that use other auxiliary indicators for their operation.
For example, the famous indicator MACD uses two copies of the EMA (Exponential Moving Average) indicator calculating difference between their values:
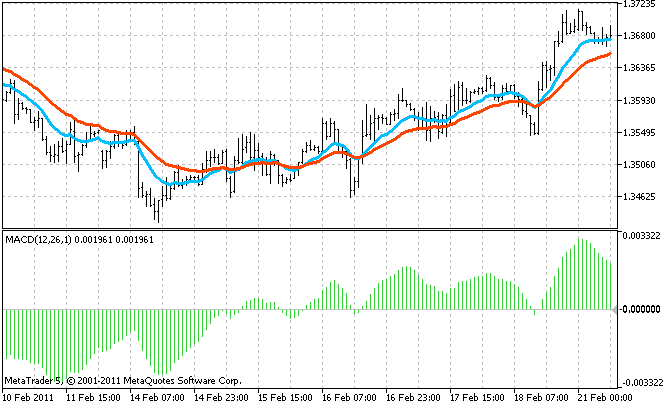
Such a composite indicator is equivalent to several simple ones, in fact. For example, previously mentioned MACD consumes the memory and processor time three times more than single EMA, since it has to allocate memory for buffers of the main indicator and buffers of all its auxiliary indicators.
Besides MACD, there are more complex indicators that use more than two auxiliary indicators.
Moreover, those memory expenses increase greatly if:
- the indicator uses multiple timeframes (for example, it tracks concurrency of waves on several timeframes), thus is creates separate copies of auxiliary indicators for each timeframe;
- the indicator is multi-currency;
- a trader uses the indicator for trading on several currency pairs (I know people that trade more than two tens of pairs simultaneously).
A combination of those conditions can lead to a simple lack of memory on a computer (I know real cases, when a client terminal required gigabytes of memory due to using of such indicators). Here is an example of a lack of memory in the MetaTrader 5 client terminal:

In such situation, the terminal is not able to place the indicator on a chart or calculate it correctly (if the code of the indicator doesn't handle the error of memory allocation), or it can even shut down.
Luckily, the terminal can compensate a lack of memory using more virtual memory, i.e. storing a part of information on the hard disk. All the programs will operate, but very slowly...
2. The Test Composite Indicator
To continue our investigation within the scope of this article, let's create a composite indicator; the one that is more complex than MACD.
Let it be an indicator that tracks initiation of trends. It will sum up signals from 5 timeframes, for example: H4, H1, M15, M5, M1. It will allow fixing resonance of big and small arising trends, what should increase reliability of forecasts. As the source of signal on each timeframe, we are going to use the Ichimoku and Price_Channel indicators included in the MetaTrader 5 delivery:
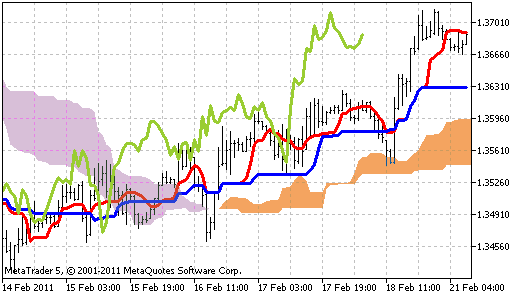
- if the Tenkan (red) line of Ichimoku is above the Kijun (blue) line, the trend is ascending; and if it is below then the trend is descending;
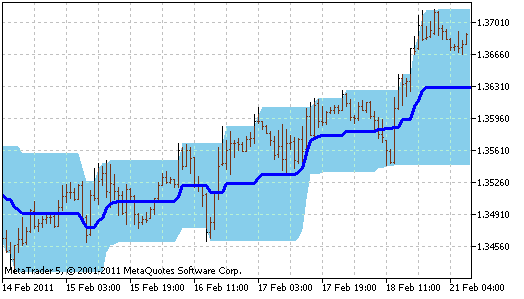
- if the price is above the middle line of Price_Channel, the trend is ascending; if the is below then the trend is descending.
In total, our indicator will use 10 auxiliary indicators: 5 timeframes with 2 indicators on each. Let's call our indicator Trender.
Here is its full source code (it is also attached to the article):
#property indicator_separate_window
#property indicator_buffers 1
#property indicator_plots   1
#property indicator_minimum -1
#property indicator_maximum  1

#property indicator_type1   DRAW_HISTOGRAM
#property indicator_color1  DarkTurquoise

// The only buffer of the indicator
double ExtBuffer[];

// Timeframes of auxiliary indicators
ENUM_TIMEFRAMES TF[5] = {PERIOD_H4, PERIOD_H1, PERIOD_M15, PERIOD_M5, PERIOD_M1};

// Handles of auxiliary indicators for all timeframes
int h_Ichimoku[5], h_Channel[5];

//+------------------------------------------------------------------+
void OnInit()
  {
   SetIndexBuffer(0, ExtBuffer);
   ArraySetAsSeries(ExtBuffer, true);

   // Create auxiliary indicators
   for (int itf=0; itf<5; itf++)
     {
      h_Ichimoku[itf] = iCustom(Symbol(), TF[itf],
                                "TestSlaveIndicators\\Ichimoku",
                                9, 26, 52
                               );
      h_Channel [itf] = iCustom(Symbol(), TF[itf],
                                "TestSlaveIndicators\\Price_Channel",
                                22
                               );
     }
  }
//+------------------------------------------------------------------+
int OnCalculate(const int rates_total,
                const int prev_calculated,
                const datetime& time[],
                const double& open[],
                const double& high[],
                const double& low[],
                const double& close[],
                const long& tick_volume[],
                const long& volume[],
                const int& spread[])
  {
   ArraySetAsSeries(time, true);

   int limit = prev_calculated ? rates_total - prev_calculated : rates_total -1;

   for (int bar = limit; bar >= 0; bar--)
     {
      // Time of the current bar
      datetime Time  = time [bar];

      //--- Gather signals from all timeframes
      double Signal = 0; // total signal
      double bufPrice[1], bufTenkan[1], bufKijun [1], bufMid[1], bufSignal[1];
      for (int itf=0; itf<5; itf++)
        {
         //=== Bar price
         CopyClose(Symbol(), TF[itf], Time, 1, bufPrice);
         double Price = bufPrice[0];

         //=== The Ichimoku indicator
         CopyBuffer(h_Ichimoku[itf], 0, Time, 1, bufTenkan);
         double Tenkan = bufTenkan[0];
         CopyBuffer(h_Ichimoku[itf], 1, Time, 1, bufKijun );
         double Kijun  = bufKijun [0];

         if (Tenkan > Kijun) Signal++;
         if (Tenkan < Kijun) Signal--;

         //=== The channel indicator
         CopyBuffer(h_Channel [itf], 2, Time, 1, bufMid);
         double Mid = bufMid[0];

         if (Price > Mid) Signal++;
         if (Price < Mid) Signal--;
        }

      ExtBuffer[bar] = Signal/10;
     }

   return(rates_total);
  }
//+------------------------------------------------------------------+
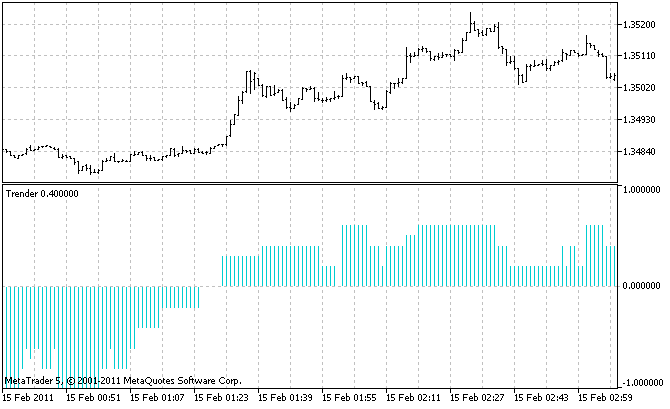
You should use this indicator on a chart with the smallest timeframe among the ones it collects the signals from; it is the only way to see all the small trends. In our case, it is the M1 timeframe. This is how the indicator looks like:
And now we move to the most important part: let's calculate the amount of memory consumed by such indicator.
Take a look in the source code of the Ichimoku indicator (the full code is attached):
#property indicator_buffers 5
and the Price_Channel indicator (the full code is attached):
#property indicator_buffers 3
In these lines, you can see that 8 buffers are created. Multiply it by 5 timeframes. And add 1 buffer of the Trender indicator itself. We have 41 buffers in total! Such impressive values are behind these seemingly simple (on a chart) indicators.
At default properties of the client terminal, one buffer contains nearly 100000 values of the double type that consume 8 bytes each. Thus 41 buffers consume nearly 31 Mb of memory. And these are only values themselves; I don't know what service information is stored in the buffers in addition to them.
You may say: "31 Mb is not much". But when a trader uses a lot of currency pairs, such volume becomes a problem. In addition to indicators, the chart themselves consume a lot of memory. Unlike indicators, each bar has several values at once: OHLC, time and volume. How can we fit it into one computer?
3. The Ways to Solve the Problem
Of course, you can install more memory into your computer. But if this variant is not suitable for you due to technical, financial or any other reasons, or if you've already exhausted the amount of memory that can be installed and it is not enough, you should examine those consuming indicator and decrease their appetite.
To do it...remember your school geometry. Assume that all the buffers of our composite indicators are a solid rectangle:

Area of this rectangle is the consumed memory. You can decrease the area by decreasing the width or height.
In this case, the width is the number of bars the indicators are drawn on. The height is the number of indicator buffers.
4. Decreasing the Number of Bars
4.1. The Simple SolutionYou don't even have to be a programmer to adjust the settings of MetaTrader:

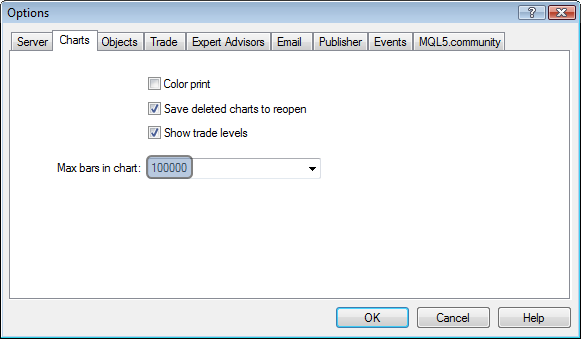
By decreasing the value of "Max bars in chart", you decrease the size of indicator buffers in those windows. It is simple, effective and available to everyone (if a trader doesn't need a deep price history when trading).
4.2. Is There Any Other Solution?
MQL5 programmers know that indicator buffers are declared in indicators as dynamic arrays with no size preset. For example, 5 buffers of Ichimoku:
double    ExtTenkanBuffer[];
double    ExtKijunBuffer[];
double    ExtSpanABuffer[];
double    ExtSpanBBuffer[];
double    ExtChinkouBuffer[];
Size of the arrays is not specified, because it is set for the entire available history by the MetaTrader 5 client terminal itself.
The same is in the OnCalculate function:
int OnCalculate (const int rates_total,      // size of the array price[]
               const int prev_calculated,  // number of bars processed at the previous call
               const int begin,            // the start of reliable data
               const double& price[]       // array for the calculation
   );
In this function, the price buffer is passed to the indicator. Memory for it is already allocated by the terminal, and a programmer cannot affect its size.
In addition, MQL5 allows using a buffer of an indicator as a price buffer for another one (draw "an indicator based on another indicator"). But even here, a programmer cannot set any limitation on the size; they just pass the indicator handle.
Thus there are no ways in MQL5 to limit the size of indicator buffers.
5. Decreasing Number of Buffers
A programmer has a huge variety of choices here. I've found several simple theoretical ways of decreasing number of buffers of a composite indicator. However, all of them imply decreasing number of buffers of auxiliary indicators, since in the main indicator all the buffers are necessary.
Let's take a detailed look at these means and check whether they actually work and what advantages and disadvantages they have.
5.1. The "Need" Method
If an auxiliary indicator contains many buffers, it may appear that not all of them are required for the main indicator. Thus we can disable unused indicators to free the memory that they consume. To do it, we need to make some changes in the source code of that auxiliary indicator.
Let's make it with one of our auxiliary indicators - Price_Channel. It contains three buffers, and Trender reads only one of them; thus we have unnecessary things to remove.
The entire code of Price_Channel (initial indicator) and Price_Channel-Need (completely remade) indicators is attached to the article. Further, I'm going to describe only the changes that have been made to it.
First of all, decrease the counter of buffers from 3 to 1:
//#property indicator_buffers 3
  #property indicator_buffers 1
//#property indicator_plots   2
  #property indicator_plots   1
Then remove two unnecessary buffer arrays:
//--- indicator buffers
//double    ExtHighBuffer[];
//double    ExtLowBuffer[];
 double    ExtMiddBuffer[];
Now, if we try to compile this indicator, the compiler will show all the row where those arrays are called:
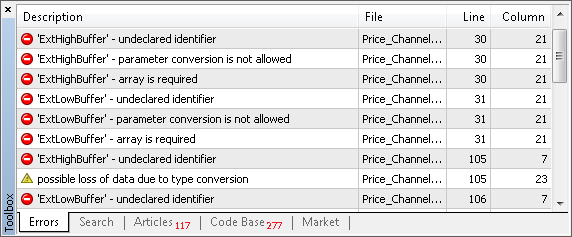
This method allows to quickly locate the things that need to be changed. It is pretty convenient when the indicator code is huge.
In our case, there are 4 "undeclared identifier" lines in total. Let's correct them.
As we could expect, two of them are located in OnInit. But together with them, we had to remove the line with necessary ExtMiddBuffer. Instead of it, we add a similar one but with another index of the buffer. As the indicator doesn't have a buffer with index 2 anymore, only 0 is possible:
//   SetIndexBuffer(0,ExtHighBuffer,INDICATOR_DATA);
//   SetIndexBuffer(1,ExtLowBuffer,INDICATOR_DATA);
//   SetIndexBuffer(2,ExtMiddBuffer,INDICATOR_DATA);
     SetIndexBuffer(0,ExtMiddBuffer,INDICATOR_DATA);
If you plan to use the "cut" indicator in a visual mode then consider that the appearance settings should be changed together with the index of buffer. In our case:
//#property indicator_type1   DRAW_FILLING
  #property indicator_type1   DRAW_LINE
If you don't need visualization, you may skip changing the appearance - it doesn't lead to errors.
Let's continue working with the "undeclared identifier" list. Two last changes (what is expectable too) are in OnCalculate, where the indicator buffer arrays are filled. Since the required ExtMiddBuffer calls the removed ExtHighBuffer and ExtLowBuffer, intermediate variables are substituted instead of them:
   //--- the main loop of calculations
   for(i=limit;i<rates_total;i++)
     {
//      ExtHighBuffer[i]=Highest(High,InpChannelPeriod,i);
        double      high=Highest(High,InpChannelPeriod,i);
//      ExtLowBuffer[i]=Lowest(Low,InpChannelPeriod,i);
        double      low=Lowest(Low,InpChannelPeriod,i);
//      ExtMiddBuffer[i]=(ExtHighBuffer[i]+ExtLowBuffer[i])/2.0;;
        ExtMiddBuffer[i]=(   high         +   low         )/2.0;;
     }
As you can see, there is nothing difficult in this entire "surgery operation". The required things were located quickly; several "scalpel cuts" and two buffers are excluded. Within the entire composite indicator Trender the total saving is 10 buffers (2*5 timeframes).
You can open Price_Channel and Price_Channel-Need one under another and see the disappeared buffers:
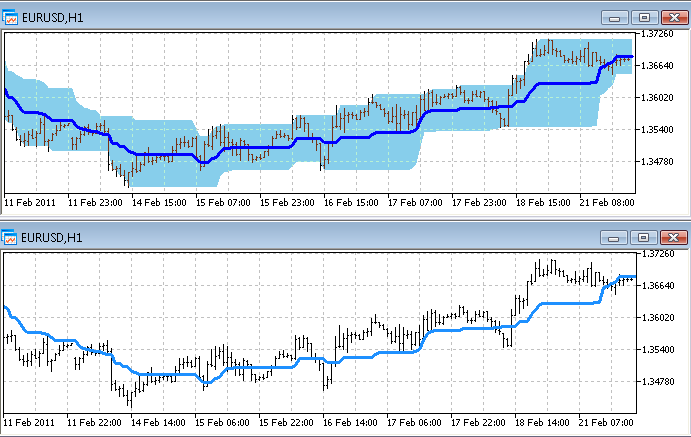
To use Price_Channel-Need in the Trender indicator, we need to correct the name of auxiliary indicator "Price_Channel" to "Price_Channel-Need" in the code of Trender. In addition, we need to change the index of the required buffer from 2 to 0. The ready-made Trender-Need is attached to the article.
5.2. The "Aggregate" Method
If a main indicator reads data of more than one buffer of an auxiliary indicator and then it performs an aggregating action with it (for example, addition or comparison), then it is not necessary to perform this action in the main indicator. We can make it in an auxiliary indicator and then pass the result to the main one. Thus it is not necessary to have several buffers; all of them are replaced with one.
In our case, such method is applicable to Ichimoku. As Trender uses of 2 buffers from it (0 - Tenkan and 1 - Kijun):
         CopyBuffer(h_Ichimoku[itf], 0, Time, 1, bufTenkan);
         double Tenkan = bufTenkan[0];
         CopyBuffer(h_Ichimoku[itf], 1, Time, 1, bufKijun );
         double Kijun  = bufKijun [0];

         if (Tenkan > Kijun) Signal++;
         if (Tenkan < Kijun) Signal--;
If we aggregate 0 and 1 buffer of Ichimoku to one signal buffer, then the fragment of Trender shown above will be replaced with the following one:
         CopyBuffer(h_Ichimoku[itf], 0, Time, 1, bufSignal);

         Signal += bufSignal[0];
The full Trender-Aggregate is attached to the article.
Now, let's look at key changes that should be made to Ichimoku.
Moreover, this indicator contains unused buffers. So in addition to the "Aggregate" method, we can apply the "Need" method. Thus only one buffer of 5 is left in Ichimoku - the one that aggregates the necessary buffers:
//#property indicator_buffers 5
  #property indicator_buffers 1
//#property indicator_plots   4
  #property indicator_plots   1
Let's give a new name to the only buffer:
//--- indicator buffers
//double    ExtTenkanBuffer[];
//double    ExtKijunBuffer[];
//double    ExtSpanABuffer[];
//double    ExtSpanBBuffer[];
//double    ExtChinkouBuffer[];
  double    ExtSignalBuffer[];
The new name has a practical meaning - it allows deleting all the names of previously used buffers from the indicator. It will allow (using compilation as described in the "Need" method) quick finding all lines that should be changed.
If you are going to visualize the indicator on a chart, then don't forget to change the appearance settings. Also you should consider that in our case, the aggregating buffer has a different range of values comparing to two buffers consumed by it. Now it doesn't show a price derivative, but which of two buffers is bigger. It is more convenient to display such results in a separate window below a chart:
//#property indicator_chart_window
  #property indicator_separate_window
So, make the following changes in OnInit:
//--- indicator buffers mapping
//   SetIndexBuffer(0,ExtTenkanBuffer,INDICATOR_DATA);
//   SetIndexBuffer(1,ExtKijunBuffer,INDICATOR_DATA);
//   SetIndexBuffer(2,ExtSpanABuffer,INDICATOR_DATA);
//   SetIndexBuffer(3,ExtSpanBBuffer,INDICATOR_DATA);
//   SetIndexBuffer(4,ExtChinkouBuffer,INDICATOR_DATA);
     SetIndexBuffer(0,ExtSignalBuffer,INDICATOR_DATA);
And the most interesting part is in OnCalculate. Note: three unnecessary buffers are simply deleted (as we use the "Need" method), and the necessary ExtTenkanBuffer and ExtKijunBuffer are replaced with temporary variables Tenkan and Kijun. Those variables are used at the end of cycle for the calculation of the aggregating buffer ExtSignalBuffer:
   for(int i=limit;i<rates_total;i++)
     {
//     ExtChinkouBuffer[i]=Close[i];
      //--- tenkan sen
      double high=Highest(High,InpTenkan,i);
      double low=Lowest(Low,InpTenkan,i);
//     ExtTenkanBuffer[i]=(high+low)/2.0;
       double  Tenkan    =(high+low)/2.0;
      //--- kijun sen
      high=Highest(High,InpKijun,i);
      low=Lowest(Low,InpKijun,i);
//     ExtKijunBuffer[i]=(high+low)/2.0;
       double  Kijun    =(high+low)/2.0;
      //--- senkou span a
//     ExtSpanABuffer[i]=(ExtTenkanBuffer[i]+ExtKijunBuffer[i])/2.0;
      //--- senkou span b
      high=Highest(High,InpSenkou,i);
      low=Lowest(Low,InpSenkou,i);
//     ExtSpanBBuffer[i]=(high+low)/2.0;

       //--- SIGNAL
       double Signal = 0;
       if (Tenkan > Kijun) Signal++;
       if (Tenkan < Kijun) Signal--;
       ExtSignalBuffer[i] = Signal;
     }
Minus 4 buffers in total. And if we applied only the "Need" method to Ichimoku, we would have only 3 buffers less.
Within the entire Trender the saving is 20 buffers in total (4 * 5 timeframes).
The full code of Ichimoku-Aggregate is attached to the article. To compare this indicator to the original one, open both of them on a single chart. As you remember, the modified indicator is now displayed below the chart in a separate window:
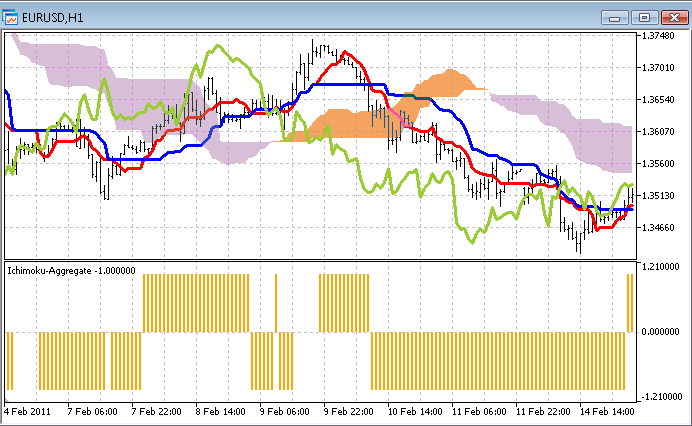
5.3. The "Include" Method
The most radical way to decrease the number of buffers is to get rid of all auxiliary indicators. If we do so, only one buffer will be left in our indicator - the one that belongs to the main indicator. There cannot be fewer buffers.
The same result can be achieved by moving the code of auxiliary indicators to the main indicator. Sometimes it may appear to be a time-taking thing to do, but the final effect is worth of it. The most difficult is to adapt the code moved from the indicators. It is not intended to work within the code of another indicator.
Here are the main problems that arise during it:
- Conflict of names. The same names of variables, functions (especially system functions like OnCalculate);
- Absence of buffers. In some indicators, it can be a insuperable obstacle if the logic of indicators is closely connected with storing/processing of data in buffers. In our case, replacing of buffers with simple arrays is not a panacea, since our aim is to decrease the memory consumption. It is important to refuse from storing of a gigantic history data in memory.
Let's demonstrate the methods that allow solving these problems effectively.
Each auxiliary indicator should be written as a class. Then all the variables and functions of indicators will always have (within their classes) unique names and will not be in conflict with the other indicators.
If many indicators are moved, you can think of standardization of those classes to avoid confusion when using them. For this purpose, create a base indicator class and inherit the classes of all auxiliary indicators from it.
I have written the following class:
class CIndicator
  {
protected:
   string symbol;             // currency pair
   ENUM_TIMEFRAMES timeframe;  // timeframe

   double Open[], High[], Low[], Close[]; // simulation of price buffers
   int BufLen; // necessary depth of filling of price buffers

public:
   //--- Analogs of standard functions of indicators
   void Create(string sym, ENUM_TIMEFRAMES tf) {symbol = sym; timeframe = tf;};
   void Init();
   void Calculate(datetime start_time); // start_time - address of bar that should be calculated
  };
Now let's create a class for the Ichimoku indicator on the basis of it. First of all, in the form of properties, write the input parameters with the original names. Not to change anything in the code of the indicator later:
class CIchimoku: public CIndicator
  {
private:
   // Simulation of input parameters of the indicator
   int InpTenkan;
   int InpKijun;
   int InpSenkou;
Keep the names of all buffers. Yes, that's what you heard - we declare all the 5 buffers of this indicator. But they are fake. They consist of only one bar each:
public:
   // Simulation of indicator buffers
   double ExtTenkanBuffer [1];
   double ExtKijunBuffer  [1];
   double ExtSpanABuffer  [1];
   double ExtSpanBBuffer  [1];
   double ExtChinkouBuffer[1];
Why did we do it? To decrease the amount of further changes in the code. You'll see it. Redefine the inherited method CIchimoku.Calculate by filling it with the code of the OnCalculate function taken from Ichimoku.
Pay attention that the loop by the history bars was removed when moving this function. Now only one bar with a specified time is calculated there. And the main code of calculations remains the same. That is why we kept so carefully all the names of buffers and parameters of the indicator.
You should also pay attention that price buffers are filled with values at the very beginning of the Calculate method. There are as many values as required for calculation of one bar.
   void Calculate(datetime start_time)
     {
      CopyHigh (symbol,timeframe,start_time,BufLen,High);
      CopyLow  (symbol,timeframe,start_time,BufLen,Low );
      CopyClose(symbol,timeframe,start_time,1     ,Close);

//    int limit;
      //---
//    if(prev_calculated==0) limit=0;
//    else                   limit=prev_calculated-1;
      //---
//    for(int i=limit;i<rates_total;i++)
      int i=0;
        {
         ExtChinkouBuffer[i]=Close[i];
         //--- tenkan sen
         double high=Highest(High,InpTenkan,i);
         double low=Lowest(Low,InpTenkan,i);
         ExtTenkanBuffer[i]=(high+low)/2.0;
         //--- kijun sen
         high=Highest(High,InpKijun,i);
         low=Lowest(Low,InpKijun,i);
         ExtKijunBuffer[i]=(high+low)/2.0;
         //--- senkou span a
         ExtSpanABuffer[i]=(ExtTenkanBuffer[i]+ExtKijunBuffer[i])/2.0;
         //--- senkou span b
         high=Highest(High,InpSenkou,i);
         low=Lowest(Low,InpSenkou,i);
         ExtSpanBBuffer[i]=(high+low)/2.0;
        }
      //--- done
//    return(rates_total);
     };
Of course we could skip keeping the original code. But in this case, we would have to rewrite a big part of it, what requires understanding the logic of its operation. In our case, the indicator is simple and it would be easy to understand it. But what if the indicator is complex? I have shown you the method that can help in such case.
Now let's fill the CIchimoku.Init method; everything is simple here:
   void Init(int Tenkan = 9, int Kijun = 26, int Senkou = 52)
     {
      InpTenkan = Tenkan; InpKijun = Kijun; InpSenkou = Senkou;
      BufLen = MathMax(MathMax(InpTenkan, InpKijun), InpSenkou);
     };
The Ichimoku contains two other functions that should be taken to the class CIchimoku: Highest and Lowest. They search for maximum and minimum values in a specified part of price buffers.
Our price buffers are not real; they have very small size (you've seen their filling in the Calculate method above). That is why we must slightly change the logic of operation of the Highest and Lowest functions.
In this situation, I also followed the principle of making minimum changes. All the modifications consist in adding one line that changes the indexing of bars in the buffer from the global one (when the buffer length is the entire available history) to the local one (as now the price buffers contain only values that are required for calculation of one indicator bar):
   double Highest(const double&array[],int range,int fromIndex)
     {
       fromIndex=MathMax(ArraySize(array)-1, 0);
      double res=0;
   //---
      res=array[fromIndex];
      for(int i=fromIndex;i>fromIndex-range && i>=0;i--)
        {
         if(res<array[i]) res=array[i];
        }
   //---
      return(res);
     }
The Lowest method is modified in the same way.
Similar modifications are made to the Price_Channel indicator, but it will be represented the class named CChannel. Full code of both classes is in the Trender-Include file attached to the article.
I've described the main aspect of moving the code. I think, those methods are sufficient for most indicators.
Indicators with non standard settings may cause additional difficulties. For example, Price_Channel contains unremarkable lines:
   PlotIndexSetInteger(0,PLOT_SHIFT,1);
   PlotIndexSetInteger(1,PLOT_SHIFT,1);
They mean that the indicator chart is shifted on 1 bar. In our case, it leads to the situation when the CopyBuffer and CopyHigh functions use two different bars despite that the same bar coordinates (time) are set in their parameters.
This problem is solved in Trender-Include ("ones" are added in the necessary parts of the CChannel class in distinct from the CIchimoku class where the problem does not exist). So if you need such a "crafty" indicator, you know where to look for it.
Well, we are done with moving, and both indicators are now written as two classes inside the Trender-Include indicator. It is left to change the way of calling that indicators. In Trender we had the arrays of handles, and in Trender-Include they are replaces with the arrays of objects:
// Handles of auxiliary indicator for all timeframes
//int h_Ichimoku[5], h_Channel[5];
// Instances of embedded auxiliary indicators
CIchimoku o_Ichimoku[5]; CChannel o_Channel[5];
Creation of the auxiliary indicators in OnInit now looks as following:
   for (int itf=0; itf<5; itf++)
     {
      o_Ichimoku[itf].Create(Symbol(), TF[itf]);
      o_Ichimoku[itf].Init(9, 26, 52);
      o_Channel [itf].Create(Symbol(), TF[itf]);
      o_Channel [itf].Init(22);
     }
And CopyBuffer in OnCalculate is replaced with direct call to the properties of objects:
         //=== The Ichimoku indicator
         o_Ichimoku[itf].Calculate(Time);

         //CopyBuffer(h_Ichimoku[itf], 0, Time, 1, bufTenkan);
         //double Tenkan = bufTenkan[0];
         double Tenkan = o_Ichimoku[itf].ExtTenkanBuffer[0];

         //CopyBuffer(h_Ichimoku[itf], 1, Time, 1, bufKijun );
         //double Kijun  = bufKijun [0];
         double Kijun  = o_Ichimoku[itf].ExtKijunBuffer [0];

         if (Tenkan > Kijun) Signal++;
         if (Tenkan < Kijun) Signal--;

         //=== The Channel indicator
         o_Channel[itf].Calculate(Time);

         //CopyBuffer(h_Channel [itf], 2, Time, 1, bufMid);
         //double Mid = bufMid[0];
         double Mid = o_Channel[itf].ExtMiddBuffer[0];

         if (Price > Mid) Signal++;
         if (Price < Mid) Signal--;
Minus 40 buffers. It is worth of effort.
After each modification of Trender according to the "Need" and "Aggregate" methods described previously, I tested the obtained indicators in the visual mode.
Let's conduct such a test right now: open the initial indicator (Trender) and the remade one (Trender-Include) on a chart. We can say that everything was made correctly, since the lines of both indicators accurately concur with each other:
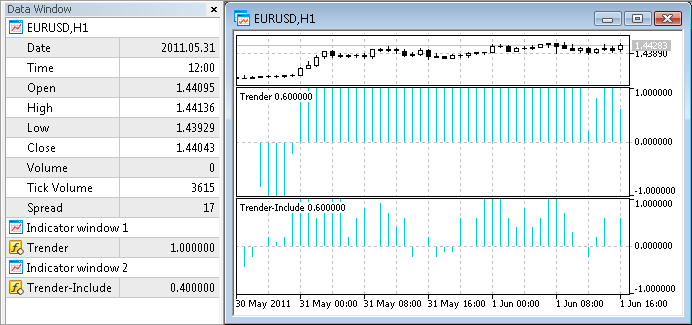
5.4. Can We Do It One by One?
We have already considered 3 ways of decreasing the number of buffers of auxiliary indicators. But what if we try to change the approach radically - if we try to decrease the number of buffers that are simultaneously kept in the memory instead of decreasing their total number? In other words, we are going to load the indicators to the memory one by one, instead of loading all the indicators at once. We need to organize a "roundabout": create one auxiliary indicator, read its data, delete it, create a next one, etc., until we go over all timeframes. The Ichimoku indicator has the largest number of buffers - 5. Thus, theoretically, maximum 5 buffers can be simultaneously kept in memory (plus 1 buffer of the main indicator), and the total saving is 35 buffers!
Is it possible? In MQL5 there is a special function for deleting indicators - IndicatorRelease.
However, it's not so easy as it seems. MetaTrader 5 cares about a high speed of operation of MQL5 programs, that's why all called timeseries are kept in cache - in case another EA, indicator or script need them. And only if they are not called for a long period of time, they are unloaded to free the memory. This timeout can be up to 30 minutes long.
Thus a constant creation and deletion of indicators will not allow achieving a great saving of memory instantly. However, it can significantly slow down computer, because an indicator is calculated for the entire price history each time it is created. Think of how reasonable it is to perform such operation at each bar of the main indicator...
Nevertheless, the idea of "indicator roundabout" was pretty interesting for a "brainstorm". If you think up any other original idea of optimization of indicator memory, write your comments to the article. Maybe they'll be put to a theoretical or practical use in one of the next articles on this subject.
6. Measuring Actual Consumption of Memory
Well, in the previous chapters, we've implemented 3 working methods of decreasing of the number of buffers of auxiliary indicators. Now, let's analyze how it decreases the actual consumption of memory.
We are going to measure the size of memory consumed by the terminal using the "Task Manager" in MS Windows. At the "Processes" tab you can see the size of RAM and virtual memory consumed by the client terminal. For example:
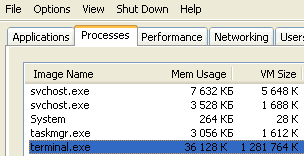
Measures are made according to the following algorithm that allows seeing the minimal consumption of memory by the terminal (that will be close to the consumption of memory by indicators):
- Download a deep price history from the MetaQuotes-Demo server (it's sufficient to run a test on a symbol for automatic downloading of its history);
- Set the terminal for a next measure (open required charts and indicators) and restart it to clear the memory from unnecessary information;
- Wait until the restarted terminal completes the calculation of all indicators. You will see it by the zero loading of the processor;
- Minimize the terminal in the task bar (by clicking the standard button "Minimize" in the upper right corner of the terminal). It will free memory that is not used for calculations at the moment (at the screenshot above you can see the example of memory consumption in the still minimized state - you can see that much less RAM than virtual memory is consumed);
- In the "Task Manager" sum up the "Mem Usage" (RAM) and "VM size" (virtual memory) columns. This is how they are called in Windows XP, the names may be slightly different in other version of the OS.
Parameters of measures:
- For measures to be more accurate, we are going to use all the currency pairs available at the MetaQuotes demo account instead of one price chart, i.e. 22 M1 charts. Then we will calculate average values;
- The "Max bars in chart" option (described in the chapter 4.1) has standard value - 100000;
- OS - Windows XP, 32 bit.
What is expected from the result of measures? There are two notes:
- Even though the Trender indicator uses 41 buffers, it doesn't mean that it consumes 41*100000 bars. The reason is the buffers are distributed among five timeframes, and the larger one contains less bars than smaller timeframes. For example, the M1 history of EURUSD contains nearly 4 million bars, and the H1 history consist of just 70000 bars (4000000/60). That is why you shouldn't expect the same decrease of memory consumption after decreasing the number of buffers in Trender;
- The memory is consumed not only by the indicator itself, but by the price series used by the indicator. Trender uses five timeframes. Thus if we decrease the number of buffers by several times, the total consumption of memory will not decrease as much. Because all those five price series in the memory will be used.
When measuring the consumption, you may face some other factors that affect the memory consumption. That is the reason why we conduct these practical measures - to see the real economy as a result of optimization of the indicator.
Below you can find the table with the result of all measures. First of all, I measured the size of memory consumed by the empty terminal. By subtracting that value from the next measure, we can calculate the size of memory consumed by one chart. Subtracting the memory consumed by the terminal and one chart from the next measures, we obtain the size of memory consumed by each indicator.
| Memory Consumer |
Indicator Buffers |
Timeframes |
Memory Consumption |
|---|---|---|---|
| The client terminal |
0 |
0 |
38 Mb for the terminal |
| Chart |
0 |
1 |
12 Mb for one empty chart |
| The Trender indicator |
41 |
5 |
46 Mb for one indicator |
| The Trender-Need indicator |
31 |
5 |
42 Mb for one indicator |
| The Trender-Aggregate indicator | 21 |
5 |
37 Mb for one indicator |
| The Trender-Include indicator | 1 |
5 |
38 Mb for one indicator |
The conclusion made on the basis of the results of measures:
- Decrease of the number of indicator buffers does not lead to the equal decrease of memory used by the indicator.
The origin of this effect is described above in this chapter. Maybe if the indicator used less timeframes, the effect of decreasing the number of buffers would be more significant.
- Moving the code of auxiliary indicators to the main indicator doesn't always lead to the best result.
So why is the Include method not so effective as Aggregate? To determine the reason, we need to remember main differences of code of these indicators. In Aggregate, price series necessary for calculations are passes by the terminal as input arrays in OnCalculate. In Include, all the data (for all timeframes) is actively requested for each bar using CopyHigh, CopyLow and CopyClose. Probably, that is what leads to additional consumption of memory, caused by the peculiarities of caching of price timeseries when those functions are used.
Conclusion
So, this article tells about 3 working methods of decreasing the consumption of memory on auxiliary indicators and 1 method of saving memory by adjusting the client terminal.
A method that should be applied depends on acceptability and propriety in your situation. The number of saved buffers and megabytes depends on indicators you work with: in some of them you'll be able to "cut" a lot, and in others you won't be able to do anything.
Saving memory will allow increasing the number of currency pairs simultaneously used in the terminal. It increases the reliability of your trade portfolio. Such a simple care about technical resources of your computer can turn into money resources at your deposit.
Attachments
The indicators described in the article are attached. For everything to work, save them in the "MQL5\Indicators\TestSlaveIndicators" folder, because all the versions of the Trender indicator (except Trender-Include) look for their auxiliary indicators in it.