A Library for Constructing a Chart via Google Chart API
Евгений | 19 July, 2010
Introduction
The Google Chart allows the building of 11 types of different charts. Here they are:- Line charts
- Bar charts
- Scatter charts
- Radar charts
- Candlestick charts
- Venn Charts
- QR codes
- Map charts
- Formulas
- Graph charts
- Pie Chart
Quite a sufficient work set as was stated in the description of the articles - all that you need to do to obtain a ready chart - is to send a specially assembled query to the Google server. A simple example of how to do this has been implemented in article Creating an information board using the standard library classes and Google Chart API, but this is hardly even a tenth part of what this service can provide. Naturally, in order to properly assemble a request, we need to examine its structure and key words, therefore, in this article we will attempt to create a class library, the use of which will allow the user to quickly create the desired chart, and place it on the chart, as well as dynamically update the data, on the basis of which the chart was constructed.
It must be noted right away that there will be no massive computations of the library code in this article, but instead, there will be an attached certificate, created using Doxygen (details in the article Auto-Generated Documentation for MQL5 Code). In it you will be able to find descriptions of public methods of library classes and documentation on enumerations and exceptions, which arise in the process of creating the chart.
1. Description of the means of obtaining and displaying charts
Let's start from the end. Suppose that we formulated the request correctly. Now you need to send it to the server, record the answer into a file, and attach the file to a graphic object on the graph in order to display the chart. To work with the Internet we use the functions described in the article Using WinInet.dll for Data Exchange between Terminals via the Internet.
Also there is one small catch: the components, which are designed to display images (Picture and Graphic tag) only work with images in the format BMP, while the Google Chart only returns PNG or GIF. Consequently, you will need to convert the image. This id one by the function Convert_PNG (). The function code for obtaining the chart looks like this:
bool CDiagram::GetChart()
{
   if(!ObjExist()) {SetUserError(DIAGRAM_ERR_OBJ_NOT_EXIST); return false;}
   string request=CreateRequest();
   //Print(request);
   if(StringLen(request)>2048) {SetUserError(DIAGRAM_ERR_TOO_LARGE_REQUEST); return false;}
   //try to establish a connection
   int rv=InternetAttemptConnect(0);
   if(rv!=0) {SetUserError(DIAGRAM_ERR_INTERNET_CONNECT_FAILED); return false;}
   //initialize the structures
   int hInternetSession=InternetOpenW("Microsoft Internet Explorer", 0, "", "", 0);
   if(hInternetSession<=0) {SetUserError(DIAGRAM_ERR_INTERNET_CONNECT_FAILED); return false;}
   //send request
   int hURL=InternetOpenUrlW(hInternetSession, request, "", 0, 0, 0);
   if(hURL<=0) SetUserError(DIAGRAM_ERR_INTERNET_CONNECT_FAILED);
   //prepare the paths for conversion
   CString src;
   src.Assign(TerminalInfoString(TERMINAL_PATH));
   src.Append("\MQL5\Files\\"+name+".png");
   src.Replace("\\","\\\\");
   CString dst;
   dst.Assign(TerminalInfoString(TERMINAL_PATH));
   dst.Append("\MQL5\Images\\"+name+".bmp");
   dst.Replace("\\","\\\\");
   DeleteFileW(dst.Str());
   DeleteFileW(src.Str());
   CFileBin chart_file;//file into which the results are recorded
                       //create it
   chart_file.Open(name+".png",FILE_BIN|FILE_WRITE);
   //****************************
   int dwBytesRead[1];// number of recorded documents
   char readed[1000];//the actual data
                    //read the data, received from the server after the request
   while(InternetReadFile(hURL,readed,1000,dwBytesRead))
     {
      if(dwBytesRead[0]<=0) break;//no data - exit
      chart_file.WriteCharArray(readed,0,dwBytesRead[0]);//record the data into the file
     }
   InternetCloseHandle(hInternetSession);//terminate the connection
   chart_file.Close();//and file
   //convert the file
   if(!Convert_PNG(src.Str(), dst.Str())) SetUserError(DIAGRAM_ERR_IMAGE_CONVERSION_FAILED);
   //attach the file to the graphic object
   switch (obj_type)
   {
      case OBJ_BITMAP:
      {
         ObjectSetString(chart_ID, name, OBJPROP_BMPFILE, name+".bmp");
         return true;
      }
      case OBJ_BITMAP_LABEL:
      {
         ObjectSetString(chart_ID, name, OBJPROP_BMPFILE, 0, name+".bmp");
         ObjectSetString(chart_ID, name, OBJPROP_BMPFILE, 1, name+".bmp");
         return true;
      }
      default: return false;
   }
   //redraw the chart
   ChartRedraw();
}
It is worth noting my extensive use of classes of the Standard Library during the creation of the Google Charts library, for which I extend special thanks to its developers.
2. Overview of the Google Charts library's components
Request to the server should begin as follows: http://chart.apis.google.com/chart?cht = , further you need to indicate the type of the chart, and only then all of the other parameters. The request, in addition to the header, consists of commands and their parameters. The commands are divided from each other by the "&" symbol. For example, the command & Chtt = Title will set the word "Title" in the header of the chart.
So here we go.
2.1 Line charts
This is perhaps the most frequently used chart, which has the largest number of properties. The construction of the chart is done by the CLineXYChart class. Example:
CLineXYChart chart;
chart.Attach(0, "test diagram");
chart.SetSize(200,200);
double Y[10]={-50, -40, -25, -35, 10, 50, 70, 40, 15, 80};
chart.AddLine(Y, Red, 0, "Test line");
chart.GetChart();
As a result, in the component named "Test diagram" you see the following image:
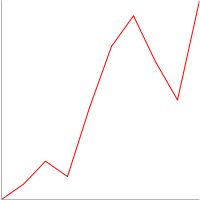
Figure 1. A simple example of constructing a line chart
Recall that a certificate of class methods can be found in the attached certificate, here are some examples of its use.
Complicate the chart by adding another line of the axis and grid:
//create a copy of the class
CLineXYChart chart;
//attach it to the object constructed earlier
chart.Attach(0, "test diagram");
//set the size
chart.SetSize(200,200);
//prepare the data
double Y2[10]={-70, -5, 6, 8, 10, 20, 100, 130, 90, 60};
double Y[10]={-50, -40, -25, -35, 10, 50, 70, 40, 15, 80};
//add lines
chart.AddLine(Y, Red, 0, "Test line");
chart.AddLine(Y2, Blue, 0, "Test line 2");
//axis
chart.SetAxis(DIAGRAM_AXIS_BOTTOM|DIAGRAM_AXIS_LEFT, -1, 0, 0, 10, 0);
//and grid
chart.SetGrid();
//obtain the chart
chart.GetChart();
The chart now takes the same view as on the image below. It's worth noting one important feature - the GetChart () method should be call after the other methods, because it is the method that receives the chart.
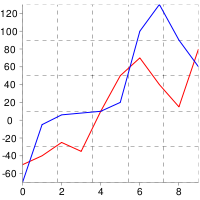
Figure 2. A more complex example of a linear graph
And that's not all. Add the markers, the title, the legend, and the filling:
//create a class copy
CLineXYChart chart;
//attach it to the object created earlier
chart.Attach(0, "test diagram");
//set the size
chart.SetSize(500,300);
//prepare the data
double Y2[10]={-70, -5, 6, 8, 10, 20, 100, 130, 90, 60};
double Y[10]={-50, -40, -25, -35, 10, 50, 70, 40, 15, 80};
//add lines
int first_line=chart.AddLine(Y, Red, 0, "Test line");
int second_line=chart.AddLine(Y2, Blue, 0, "Test line 2");
//axis
chart.SetAxis(DIAGRAM_AXIS_BOTTOM|DIAGRAM_AXIS_LEFT, -1, 0, 0, 10, 0);
//grid
chart.SetGrid();
//legend
chart.ShowLegend();
//title
chart.SetTitle("My Chart", Green, 15);
//filling
chart.SetFill(Linen);
//markers
chart.SetLineMarker(first_line, DIAGRAM_LINE_MARKERS_DIAMOND, BlueViolet, 10);
chart.SetLineMarker(second_line, DIAGRAM_LINE_MARKERS_CROSS, YellowGreen, 15);
//obtain the chart
chart.GetChart();
For the configuration of the properties, which are unique to a particular line, we use identifiers (first_line and second_line), which are then forwarded to the appropriate methods.
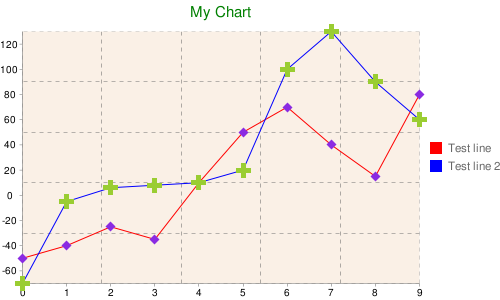
Figure 3. An even More b complex example of a line chart
But even this is not the end. There is a possibility of adding tags to the line, filling in the area under the line and between lines, scaling the lines, and adding a line to the minor axis:
//create a class copy
CLineXYChart chart;
//attach it to the object created earlier
chart.Attach(0, "test diagram");
//set the size
chart.SetSize(700,400);
//prepare the data
double Y3[10]={1000, 1200, 1800, 1700, 1300, 900, 700, 750, 800, 600};
double X3[10]={2, 4, 5, 6, 10, 15, 17, 20, 21, 23};
double Y2[10]={-70, -5, 6, 8, 10, 20, 100, 130, 90, 60};
double Y[10]={-50, -40, -25, -35, 10, 50, 70, 40, 15, 80};
//add lines
int first_line=chart.AddLine(Y, Red, 0, "Test line");
int second_line=chart.AddLine(Y2, Blue, 0, "Test line 2");
int third_line=chart.AddLine(Y3, X3, Green, 0, "Test line 3");
//major axis
chart.SetAxis(DIAGRAM_AXIS_BOTTOM|DIAGRAM_AXIS_LEFT, -1, 0, 0, 10, 0);
//minor axis
chart.SetAxis(DIAGRAM_AXIS_RIGHT|DIAGRAM_AXIS_TOP, third_line, 0, Red, 15, 2);
//grid
chart.SetGrid();
//legend
chart.ShowLegend(DIAGRAM_LEGEND_POSITION_BOTTOM_HORIZONTAL);
//title
chart.SetTitle("My Chart", Green, 15);
//filling in the chart
chart.SetFill(Linen, Silver);
//markers
chart.SetLineMarker(first_line, DIAGRAM_LINE_MARKERS_DIAMOND, BlueViolet, 10);
chart.SetLineMarker(second_line, DIAGRAM_LINE_MARKERS_CROSS, YellowGreen, 15);
//set the filling between the two lines
chart.SetLineFilling(first_line, Lime , second_line);
//add tags
chart.AddLabel(first_line, DIAGRAM_LABEL_TYPE_FLAG, 5, "Flag", Red, 15);
chart.AddLabel(second_line, DIAGRAM_LABELS_TYPE_ANNOTATION, 3, "annotation", Blue, 25);
//slightly compress the lines (by 20%)
chart.SetLineScaling(second_line, false, 20);
//attach the third line to the minor axis
chart.SetLineScaling(third_line, true, 20);
//obtain the chart
chart.GetChart();
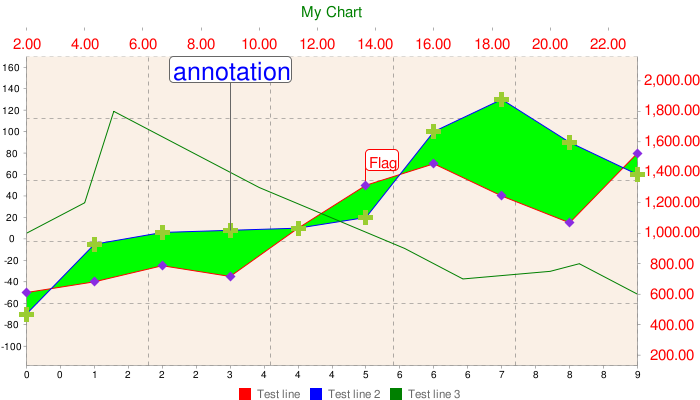
Figure 4. All of the features of the line chart
If you want to dynamically update the chart's data, then you can use the method SetLineData (), or completely remove the line with the old data, using DeleteLine (), and create a new one. However, the first method is preferable.
2.2 Bar charts
In other words, this is a bar graph. The CBarChart class is responsible for constructing it. This differs from the CLineXYChart because of the absence of the markers, the need to specify a set of data for the X axis, and the presence of certain features, which are unique to the charts of this type. In all other aspects everything is the same as in the CLineXYChart.
Example:
CBarChart chart;
chart.Attach(0, "test diagram");
//set the size
chart.SetSize(700,400);
//prepare the data
double Y3[10]={100, 120, 18, 17, 13, 9, 70, 75, 80, 60};
double Y2[10]={70, 5, 6, 8, 10, 20, 100, 130, 90, 60};
double Y[10]={50, 40, 25, 35, 10, 50, 70, 40, 15, 80};
//add lines
int first_line=chart.AddLine(Y, Red, 0, "Test bar 1");
int second_line=chart.AddLine(Y2, Blue, 0, "Test bar 2");
int third_line=chart.AddLine(Y3, Green, 0, "Test bar 3");
//major axis
chart.SetAxis(DIAGRAM_AXIS_BOTTOM|DIAGRAM_AXIS_LEFT, -1, 0, 0, 10, 0);
//grid
chart.SetGrid();
//legend
chart.ShowLegend();
//title
chart.SetTitle("My Chart", Green, 15);
//chart filling
chart.SetFill(Linen, Silver);
//obtain the chart
chart.GetChart();
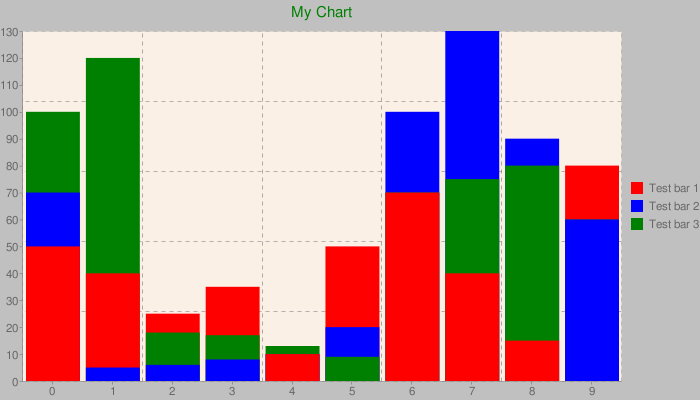
Figure 5. An example of a Bar chart
Please note that we have three data sets, and the bars are located above each other in an order, optimal for display. However, there is another way of grouping the columns. It is set using the method SetGrouped ():
/ / Set the grouping chart.SetGrouped (true);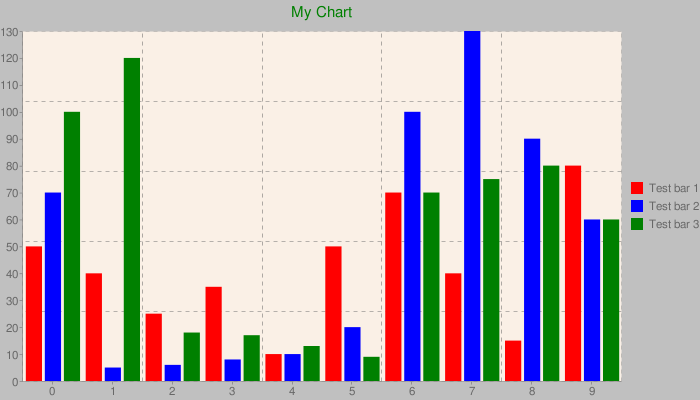
Figure 6. Example of a bar chart with a different way of grouping columns
As you can see, now the columns are not located above each other, but rather by the order of their creation.
2.3 Pie Chart
The class CPieChart constructs a pie chart. You can create a two-dimensional, as well as a three-dimensional chart:
CPieChart chart;
chart.Attach(0, "test diagram");
//set the size
chart.SetSize(300,200);
//add sections
chart.AddPieSlice(10, 0, Red, 0, "Test slice 1");
chart.AddPieSlice(20, 0, Green, 0, "Test slice 2");
chart.AddPieSlice(30, 0, Blue, 0, "Test slice 3");
//legends
chart.ShowLegend();
//title
chart.SetTitle("My Chart", Green, 15);
//display mode - 2D
chart.SetPieType(true);
//obtain the chart
chart.GetChart();

Figure 7. 2D and 3D examples of pie charts
The type of display (2D or 3D) is established by calling the SetPieType () method. Another useful feature is the ability to set multiple rings, however in this case, only the 2D mode will be available. For setting the second ring, specify the dimensional parameter of the AddPieSlice () method as different from zero:
//add the second ring
chart.AddPieSlice(50, 1, YellowGreen, 0, "Test ring 1");
chart.AddPieSlice(20, 1, Magenta, 0, "Test ring 2");
chart.AddPieSlice(70, 1, Maroon, 0, "Test ring 3");
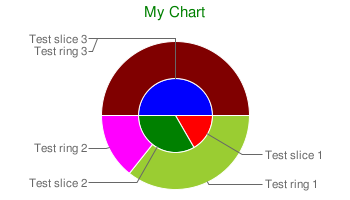
Figure 8. Concentric Pie Chart
Note that the chart above also contains remote sector tags. They are set by the SetPieLabels () method, and can replace a legend. However, there is one disadvantage - the size of the tags are not automatically fitted to the size of the chart, which can lead to to them overflowing beyond its boundaries. In such a case, you need to increase the width of the chart. The setting of grids, axes, markers, and scales is not provided by this chart type. The sector can be removed by the DeleteLine () method.
2.4 Radar chart
The CRadarChart class constructs radar charts. It has no differences from the CLineXYChart class. All of its methods are available in CRadarChart:
CRadarChart chart;
chart.Attach(0, "test diagram");
//set the size
chart.SetSize(300,300);
//add lines
double Y3[10]={100, 120, 18, 17, 13, 9, 70, 75, 80, 60};
double Y2[10]={70, 5, 6, 8, 10, 20, 100, 130, 90, 60};
double Y[10]={50, 40, 25, 35, 10, 50, 70, 40, 15, 80};
int first_line=chart.AddLine(Y, Red, 0, "Test line");
int second_line=chart.AddLine(Y2, Blue, 0, "Test line 2");
int third_line=chart.AddLine(Y3, Green, 0, "Test line 3");
//set the filling between the two lines
chart.SetLineFilling(first_line, Lime , second_line);
//markers
chart.SetLineMarker(first_line, DIAGRAM_LINE_MARKERS_CIRCLE, BlueViolet, 10);
chart.SetLineMarker(second_line, DIAGRAM_LINE_MARKERS_DIAMOND, YellowGreen, 15);
//title
chart.SetTitle("My Chart", Green, 15);
//grid
chart.SetGrid();
//legend
chart.ShowLegend(DIAGRAM_LEGEND_POSITION_BOTTOM_HORIZONTAL);
//obtain the chart
chart.GetChart();
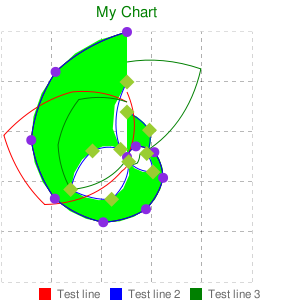
Figure 9. Radar charts
2.5 Candlestick chart
The CCandleChart class constructs the candlestick chart. The candlesticks are added by the AddCandles () method:
CCandleChart chart;
chart.Attach(0, "test diagram");
//set the size
chart.SetSize(300,300);
//add 10 candlesticks to the current chart
double Open[10], Close[10], High[10], Low[10];
CopyOpen(Symbol(), PERIOD_CURRENT, 0, 10, Open);
CopyClose(Symbol(), PERIOD_CURRENT, 0, 10, Close);
CopyHigh(Symbol(), PERIOD_CURRENT, 0, 10, High);
CopyLow(Symbol(), PERIOD_CURRENT, 0, 10, Low);
chart.AddCandles(Open, Close, High, Low);
//title
chart.SetTitle(Symbol(), Green, 15);
//grid
chart.SetGrid();
//major axis
chart.SetAxis(DIAGRAM_AXIS_LEFT, -1, 0, 0, 10, 4);
//obtain the chart
chart.GetChart();
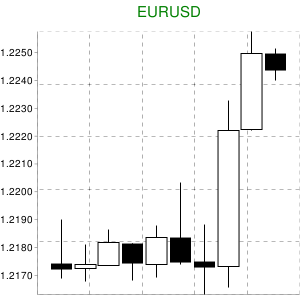
Figure 10. Candlestick chart
Markers, legends and labels are not available for this type of charts.
2.6 Formulas
The CFormulaChart class allows you to create a formula. The formula is passed in the form of a line in the language TeX to the SetFormulaString () method:
CFormulaChart chart;
chart.Attach(0, "test diagram");
//set the size
chart.SetSize(300,75);
//add the formula
chart.SetFormulaString("x=-b\pm\sqrt{b^2-4ac}\over(2a)");
//its color
chart.SetFormulaColor(Blue);
//title
chart.GetChart();
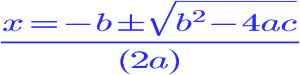
Figure 11. Formulas
The filling can also be set using the SetFill () method. No additional features are supported.
2.7 Graph charts
The CGraphChart class constructs the chart. The AddNode () and AddEdge () methods add nodes and edges to the chart:
CGraphChart chart;
chart.Attach(0, "test diagram");
//set the size
chart.SetSize(300,220);
//add nodes and edges
int A=chart.AddNode("A");
int B=chart.AddNode("B");
int C=chart.AddNode("C");
int D=chart.AddNode("D");
chart.AddEdge(A,B);
chart.AddEdge(B,C);
chart.AddEdge(C,D);
chart.AddEdge(A,C);
//set the engine
chart.SetEngine(DIAGRAM_GRAPH_ENGINE_NEATO);
//and arrows
chart.SetGraphType(false);
//title
chart.GetChart();
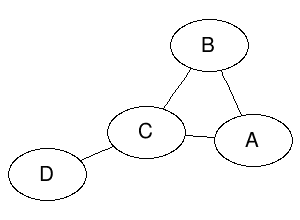
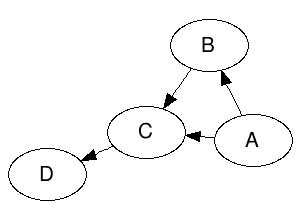
Figure 11. Graphs
The SetEngine () method sets a specific type of graphical engine, used in the construction of the graph. You can experiment with this yourself. The DeleteNode () and DeleteEdge () methods delete the nodes and edges from the chart.
2.8 Venn Charts
The CVennChart class constructs a Venn chart.
The SetCircleSizes () method determines the size of the sets, SetCircleColors (), their color, SetVennLegend () their signatures, and SetIntersections () the dimensions of the intersections:
CVennChart chart;
chart.Attach(0, "test diagram");
//set the size
chart.SetSize(300,220);
//add sets(set their sizes)
chart.SetCircleSizes(100, 90, 80);
//color
chart.SetCircleColors(Yellow, Lime, Maroon);
//signatures
chart.SetVennLegend("EURUSD", "USDJPY", "EURJPY");
//dimensions of intersections
chart.SetIntersections(30,30,30,10);
//legend
chart.ShowLegend();
//title
chart.SetTitle("Venn", Green, 15);
//title
chart.GetChart();
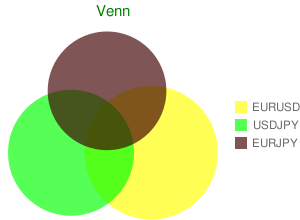
Figure 11. Venn Charts
2.9 QR codes
The CQRCode class allows you to create a QR-code:
CQRCode chart;
chart.Attach(0, "test diagram");
//set the size
chart.SetSize(300,220);
//add data
chart.SetData("test data");
//set the level of error correction during coding
chart.SetErrCorrection(DIAGRAM_QRCODE_ERROR_CORRECTION_LOW);
//and the coding
chart.SetEncoding(DIAGRAM_QRCODE_ENCODING_UTF_8);
//title
chart.GetChart();

Figure 11. QR-code
The SetData () method sets the data, based on which the code will be created. The SetErrCorrection () and SetEncoding () methods will set the correction of errors during coding and the coding.
2.10 Map charts
The CMapChart class will create a map of the world or a continent, with the possibility to select the necessary countries:
CMapChart chart;
chart.Attach(0, "test diagram");
//set the size
chart.SetSize(440,220);
//set the region
chart.SetZoomArea(DIAGRAM_MAP_AREA_AFRICA);
//and the country
chart.SetCountries("DZEGMGAOBWNGCFKECGCVSNDJTZGHMZZM");
//color
chart.SetColors(White, Red, Blue);
//color of the ocean - blue (2nd parameter)
chart.SetFill(Gray, Blue);
//title
chart.GetChart();
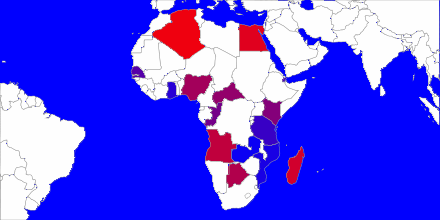
Figure 11. Map of Africa
The codes of the necessary countries are transmitted to the SetCountries () method in the ISO 3166-1-alpha-2 format. SetZoomArea() sets the continent of the map, and the SetColors() the color of the countries.
2.11 Scatter charts
The CScatterChart class constructs scatter charts. The only difference from the CLineXYChart is the way the data is specified.
Here, in order to specify the data, we use the AddLineScatter () method, in which the coordinates of points and their dimensions are transmitted:
//create a class copy
CScatterChart chart;
//attach it to the object created earlier
chart.Attach(0, "test diagram");
//set the size
chart.SetSize(300,300);
//prepare the data
double Y2[10]={70, 5, 6, 8, 10, 20, 100, 130, 90, 60};
double X2[10]={1, 2, 3, 4, 5, 6, 7, 8, 9, 10};
double Z2[10]={90, 80, 75, 90, 10, 700, 80, 90, 90, 88};
double Y[10]={50, 40, 25, 35, 10, 50, 70, 40, 105, 80};
double X[10]={1, 2, 3, 4, 5, 6, 7, 8, 9, 10};
double Z[10]={60, 90, 90, 80, 70, 90, 73, 80, 77, 100};
//add the scatters
int first_line=chart.AddLineScatter(Y, X, Z, Red, 0, "scatters 1");
int second_line=chart.AddLineScatter(Y2, X2, Z2, Blue, 0, "scatters 2");
//major axis
chart.SetAxis(DIAGRAM_AXIS_BOTTOM|DIAGRAM_AXIS_LEFT, -1, 0, 0, 10, 0);
//grid
chart.SetGrid();
//legend
chart.ShowLegend(DIAGRAM_LEGEND_POSITION_BOTTOM_HORIZONTAL);
//title
chart.SetTitle("My Chart", Green, 15);
//filling the chart
chart.SetFill(Linen, Silver);
//obtain the chart
chart.GetChart();
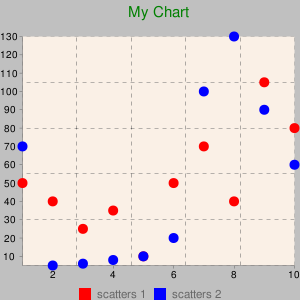
Figure 11. Scatter chart
Conclusion
I hope, dear reader, that this library will ease your difficult life as a trader. I would like to add that using OOP significantly simplifies the creation of large -scale projects, makes them more flexible and user -friendly.
Good luck.
Attachments:
| № | File name | Description |
|---|---|---|
| 1 | google_charts.mqh | Library, placed in MQL5 \\ Include |
| 2 | google_charts_test.mq5 | Test script, placed in MQL5 \\ Script |
| 3 | google_charts_help.zip | Archive with Doxygen-generated documentation to the library classes |
| 4 | Libraries.zip | Archive with libraries and their source codes, unpack in MQL5\\Libraries (libraries written in C++ Builder) |