Join our fan page
- Views:
- 14911
- Rating:
- Published:
- 2019.01.30 10:31
-
 You are missing trading opportunities:
- Free trading apps
- Over 8,000 signals for copying
- Economic news for exploring financial markets
Registration Log inYou agree to website policy and terms of use
If you do not have an account, please register
-
 Need a robot or indicator based on this code? Order it on Freelance
Go to Freelance
Need a robot or indicator based on this code? Order it on Freelance
Go to Freelance
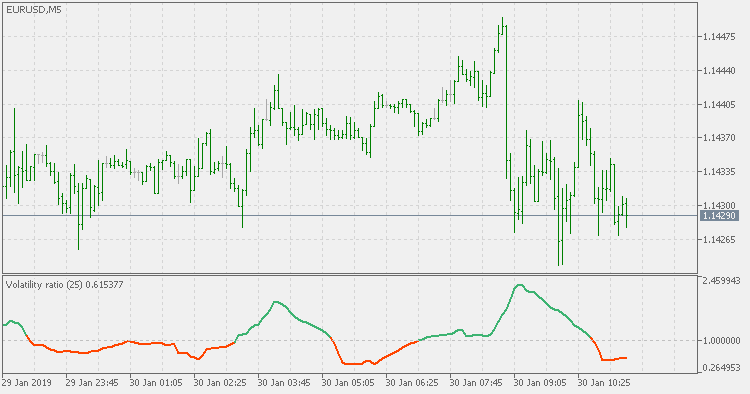
Theory :
There is always a need to measure if the market is "quiet" or it is volatile. One of the possible way is to use standard deviations, but the issue is simple : we do not have some levels that could help us find out if the market is in a state of lower or higher volatility. This indicator is attempting to do that :
- values above level 1 are indicating state of higher volatility
- values above level 1 are indicating state of lower volatility
Usage :
This is not a directional indicator. It should be used for volatility detection, not trend assessment - for that you have to use some other indicator and then check this one if the market volatility conditions are those that you expect
 Chande's DMI - std adaptive with floating levels
Chande's DMI - std adaptive with floating levels
Chande's DMI - std adaptive with dsl signal lines
Chande's DMI - std adaptive with dsl signal lines
Volatility ratio - with floating levels
Volatility ratio - standard deviations based with floating levels
RSX volatility ratio adaptive
RSX volatility ratio adaptive