Join our fan page
- Views:
- 4408
- Rating:
- Published:
- 2018.07.09 11:07
- Updated:
- 2018.09.17 10:59
-
 You are missing trading opportunities:
- Free trading apps
- Over 8,000 signals for copying
- Economic news for exploring financial markets
Registration Log inYou agree to website policy and terms of use
If you do not have an account, please register
-
 Need a robot or indicator based on this code? Order it on Freelance
Go to Freelance
Need a robot or indicator based on this code? Order it on Freelance
Go to Freelance
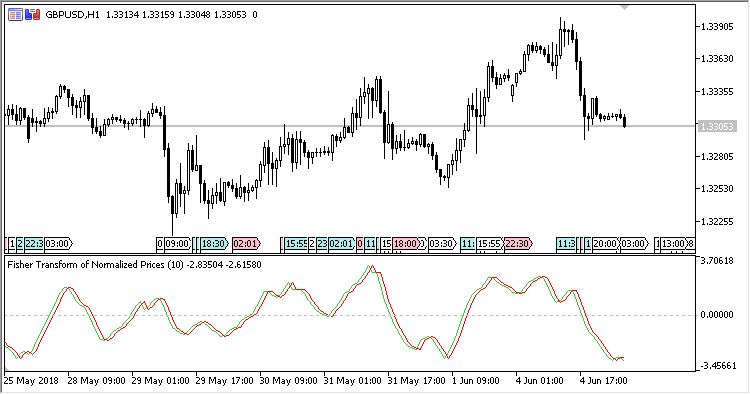
An oscillator using Fischer Transform of normalized prices.
Normalizing price flows by Fischer Transform allows you to detect the peak oscillations of the indicator line, which indicate the trend resersal points.
The indicator has two input parameters:
- Period - calculation period
- Applied price - calculation price
Calculation:
Fisher = 0.5*(Log((1+V) / (1-V)) + PrevFisher)
Trigger = PrevFisher
where:
V = (2/3) * ((Price - MinPrice) / (MaxPrice - MinPrice) - 0.5 + PrevV)
MinPrice, MaxPrice - the minimum and the maximum prices within the Period range Period
Log - natural logarithm
Translated from Russian by MetaQuotes Ltd.
Original code: https://www.mql5.com/ru/code/20997
 AbsolutelyNoLagLwma_x2_cloud_HTF
Two indicators AbsolutelyNoLagLwma from different timeframes, the area between lines being filled with a cloud, the color of which corresponds with the trend direction on the market
ColorXDerivative
Indicator Derivative additionally smoothed and made as a color histogram