Start. Deal with XAU/USD.
Fishing is one of the most ancient ways to get food and there is no person who does not know how to catch fish with a fishing rod.
Rod, line, float, weight and hook. What else is needed, besides bait on a hook, in order to catch fish? That's right, you need the appropriate skills and experience. The Russian proverb says so: “You can’t catch a fish out of a pond without labor.”
Taking freshly dug worms with a fishing rod, you can go to the river for fish. I don’t think it’s a sensible idea to take with you another kilogram of fish in addition to the worms in order to catch a couple more kilograms on the river with its help.
What am I talking about? Moreover, trading on FOREX is akin to fishing. Both here and there require the appropriate skills and experience, and here and there “those thirsting to satisfy their hunger” are trying to get food for themselves, and here and there someone does not succeed at all. And yes, FOREX is not a place where you need to come with a million to earn two. At FOREX, like going fishing, you need to come “with a fishing rod” and catch as much as your knowledge, acquired skills and accumulated experience in speculative trading allow.
The question of profitable trading on FOREX lies in the plane of choosing the necessary “fishing rod”. My choice of fishing rod is the use of the Niro Method in speculative trading - a method for modeling the future dynamics of value in the financial market, which can be found by clicking on the link in the article “Apophenia as an apologist for clairvoyance in capital markets”.
There are many types, methods and methods of fishing. Fishing can be commercial, sport, or amateur; Sometimes it’s winter, sometimes it’s summer; sometimes river, lake, sometimes sea; it happens from the shore, from a boat, from the surface of the ice, by entering a body of water, and sometimes underwater fishing; It can be float, spinning, bottom, with the use of a spear, with shooting at fish from a bow, and sometimes with shooting from an underwater gun. In general, for every taste. Well, the methods of fishing and types of fishing gear are simply impossible to list or describe due to their infinite number.
Do you understand what I'm getting at? Moreover, deciding what to buy and what to sell, where to place take profit and where to place stop loss, is preceded by fundamental and technical analyses, the types of which are endless.
There are countless ways to technically analyze charts, as well as fishing methods. My method is the Niro Method, it's no better or worse than others, it's just different.
The essence of the method for modeling the dynamics of quotes is to identify the fractal structure of the chart and describe it using attractors from the Niro Alphabet.
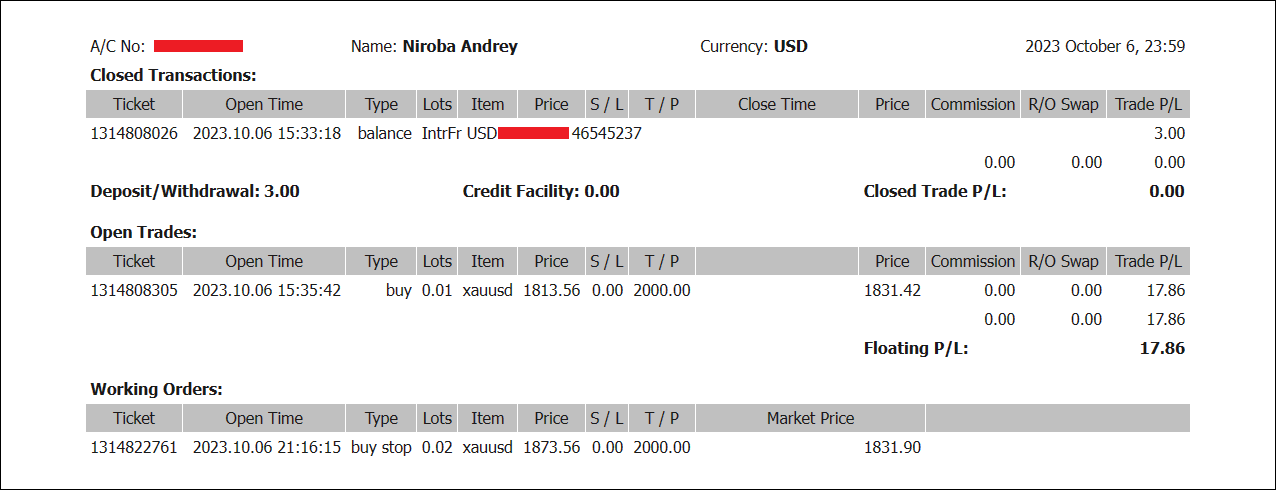
If we consider the Niro Method to be a fishing rod, then let the bait on the hook be a deposit of 3 USD, essentially equivalent to a worm strung on a hook, which has zero value compared to fish that can be eaten or sold.
Well, let's go fishing!
Let's start trading gold (XAU/USD).
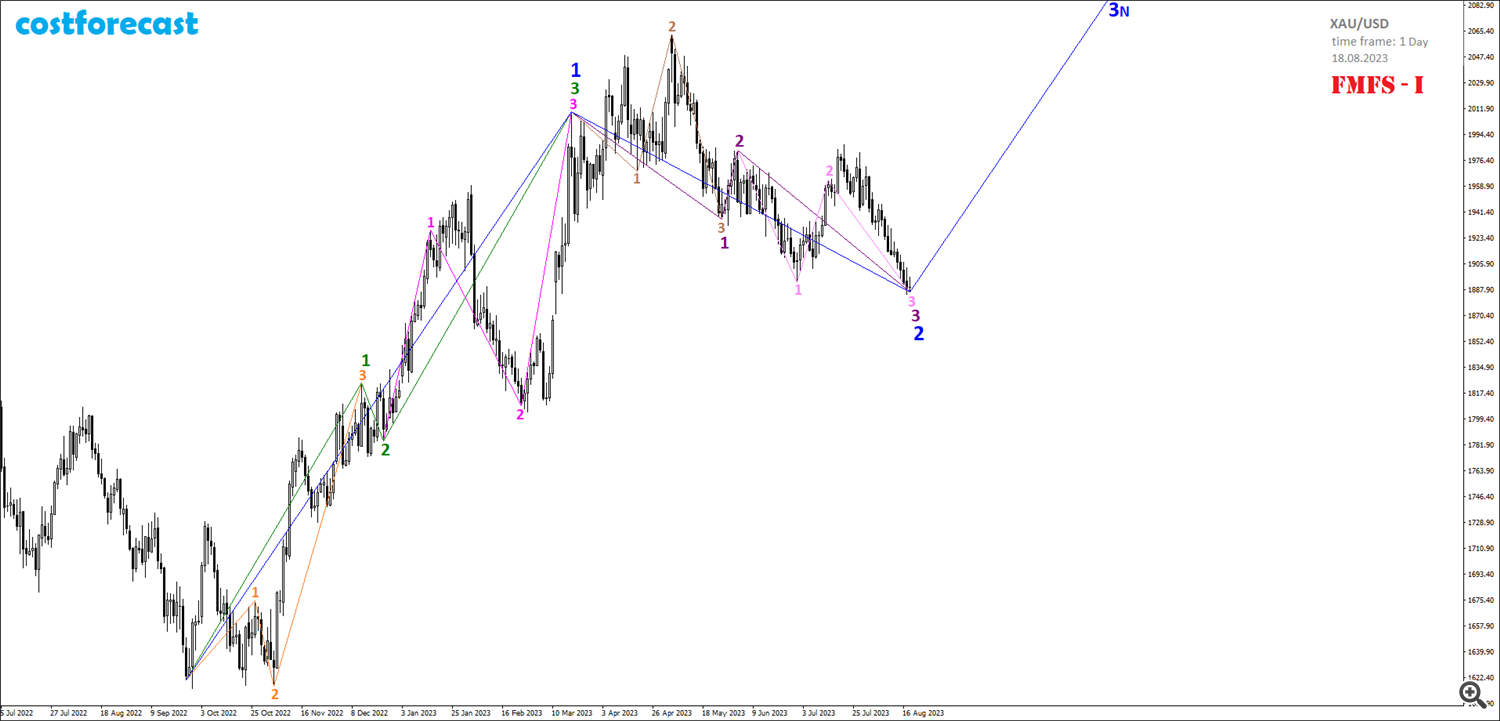
As of 08/18/2023, the most probable fractal structure of the gold price dynamics chart is the fractal structure shown in Fig. 1-1.
According to this fractal structure, the model for the future dynamics of gold prices will be the continuation of the formation of the fractal indicated in Fig. 1-1 in blue.
This FMFS-I scenario for the development of gold price dynamics (Fig. 1-1) assumes that at the point with coordinates (09.26.2022; 1621.01), a fractal began its formation, which is indicated in green, and at the point with coordinates (20.03. 2023; 2009.68) this fractal has ended.
Said green fractal formed as fractal F-#21 from Niro's Alphabet of Attractors. Moreover, the 1st segment of the green fractal was formed in the form of fractal F-No. 13, with an order one lower, which is indicated in orange on the time interval (09.26.2022; 12.13.2022). The 2nd segment of the green fractal was formed in the form of fractal F-No. 24 on the time interval (12/13/2022; 12/22/2022). The 3rd segment of the green fractal was formed in the form of fractal F-№22, which is indicated in purple on the time interval (12/21/2022; 03/20/2023).
Thus, we can assume that in the time interval (09/26/2022; 03/20/2023) the formation of the 1st segment of the fractal, indicated in blue in the cost range (1621.01; 2009.68), occurred. If this is so, then the 2nd segment of this blue fractal was formed on the time interval (03/20/2023; 08/18/2023) in the form of a fractal with an order less than one, which is indicated on the chart by fractal F-No. 21 from the Alphabet of Attractors Niro dark- purple color.
The first segment of this dark purple fractal was formed on the time interval (03/20/2023; 05/26/2023) in the form of fractal F-№14, which has an order of one less and is indicated in light brown. The 2nd segment of the dark purple fractal formed as a mono segment on the time interval (05/26/2023; 06/02/2023). Well, the 3rd segment of this dark purple fractal F-No. 21 was formed on the time interval (06/02/2023; 08/18/2023) in the form of fractal F-No. 23, which is indicated in pink on the chart.
Taking into account these assumptions, within the framework of the FMFS-I scenario, the upcoming dynamics of gold quotations will have to occur in an upward trend within the framework of the formation of the 3rd segment of the fractal, which is indicated in blue on the chart.
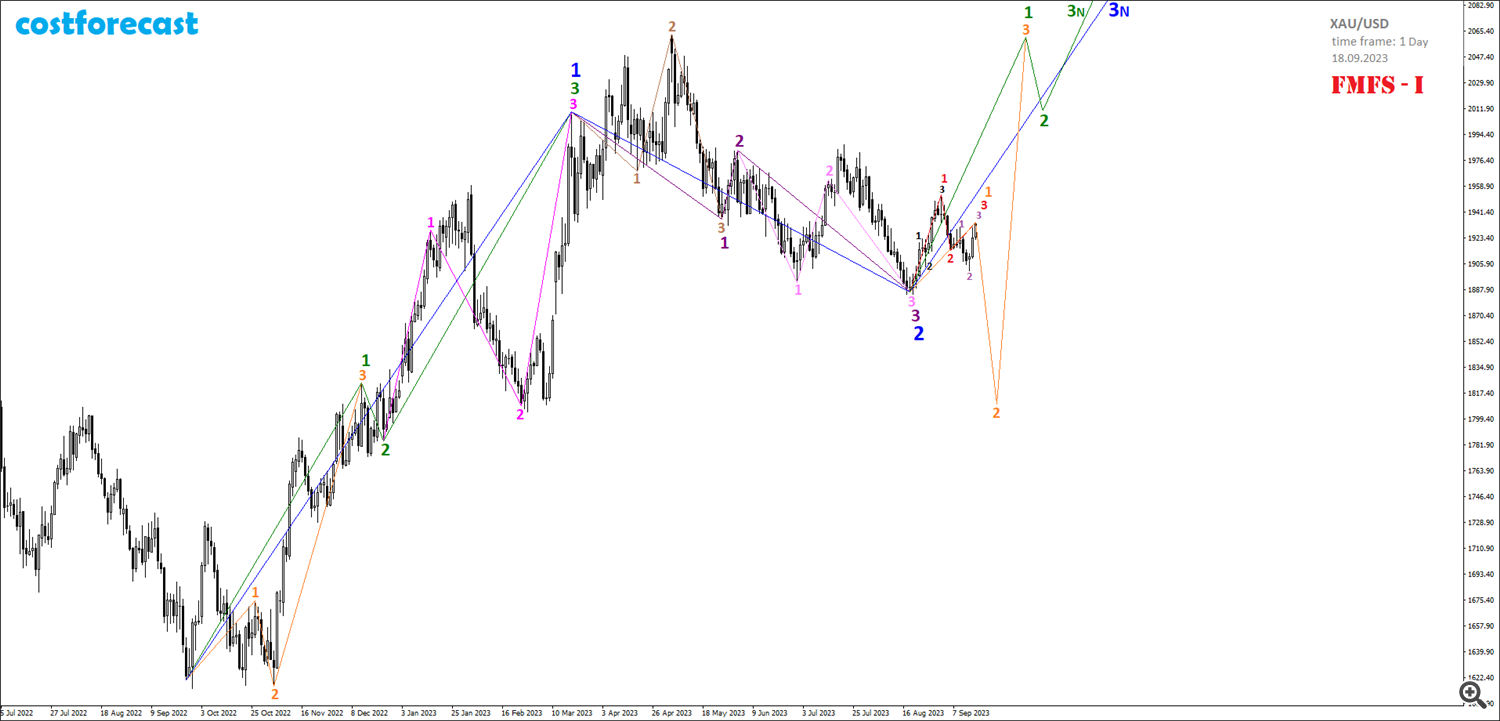
As of 08/18/2023, it was assumed that after the completion of the 2nd segment of the blue fractal on the time interval (03/20/2023; 08/18/2023), an explosive increase in gold prices would follow, within which the cost of a troy ounce would have to exceed $2,100. However, no explosive growth in quotations occurred and on the time interval (08/18/2023; 09/18/2023) a fractal structure was formed, within which the price of gold remained virtually unchanged and remained in a narrow range at $1,900 per ounce (Fig. 1 -2).
Despite the sluggish growth of quotes, the FMFS-I scenario still remains a priority for consideration. If so, then explosive growth in quotes should still be expected.
Analysis of small fractal structures shows that in the time interval (08/18/2023; 09/18/2023) fractal F-No. 34 from the Alphabet of Attractors Niro was formed, which is indicated in red on the graph. If this assumption is correct, then an explosive growth in quotes is possible only in one case, if this red fractal is the 1st segment of a larger order fractal F-No. 35, which is indicated in orange. In this case, we should expect a sharp decline in gold prices as part of the formation of the 2nd segment of the orange fractal, followed by a sharp increase in prices as part of the formation of the 3rd segment of the orange fractal towards the level of $2,100 per ounce (Fig. 1-2).
The orange fractal formed in this way will be the 1st segment of the fractal of one higher order, which is indicated in green on the graph (Fig. 1-2). After the completion of the orange fractal, gold quotations will have to decrease as part of the formation of the 2nd segment of the green fractal, after which the growth of quotations will continue at an even greater pace, updating historical highs as part of the formation of the 3rd segment of the green fractal.
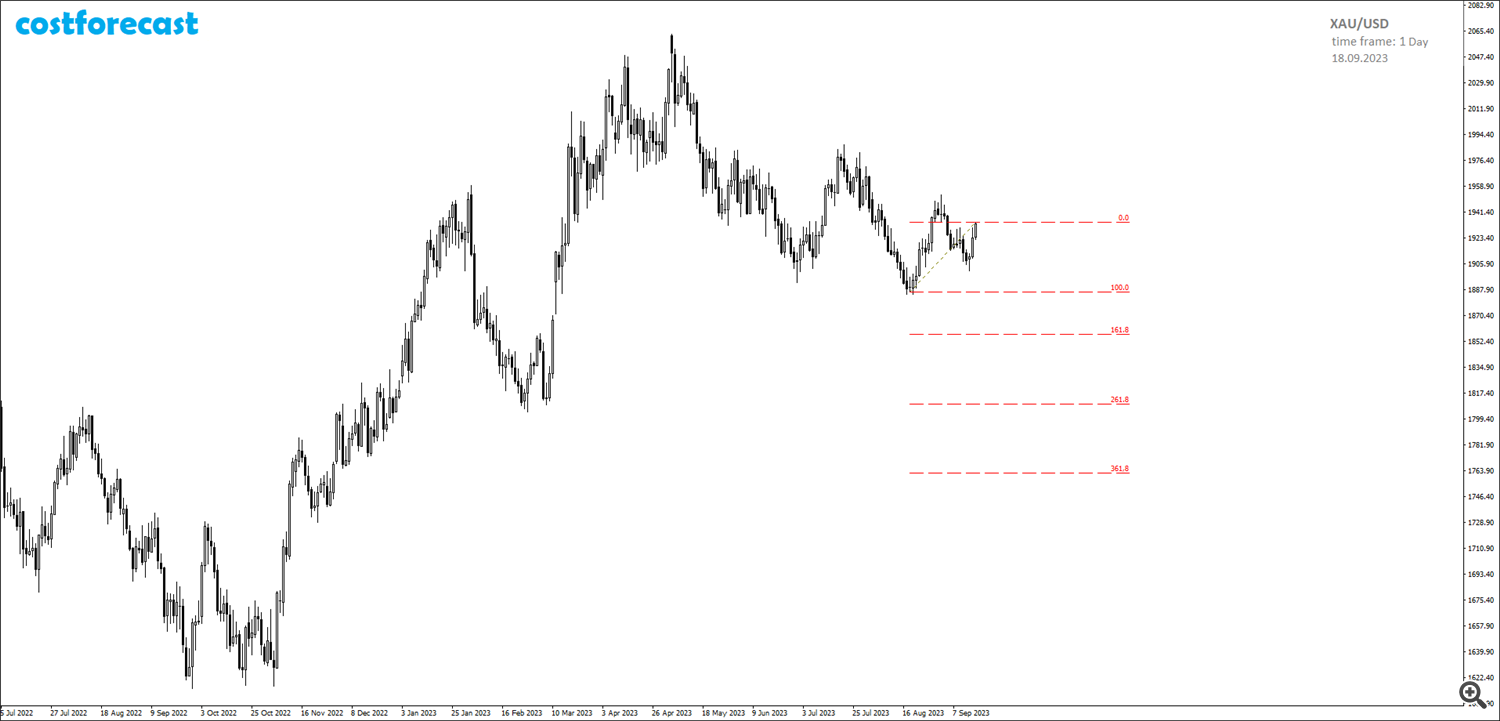
As of September 18, 2023, we can say that the most appropriate moment to buy gold will be the completion of the 2nd segment of the orange fractal at one of the Fibonacci grid levels (Fig. 1-3).
The length of the 1st segment of the orange fractal is 47.40 USD. The most likely length of the 2nd segment of the orange fractal in the event of a sharp drop in quotes will be a length equal to 2.618 of the length of the 1st segment, that is, equal to 124.09 USD. Thus, an acceptable quote for opening a long position in gold will be in the range from 1,812 to 1,815 USD per troy ounce (Fig. 1-4).
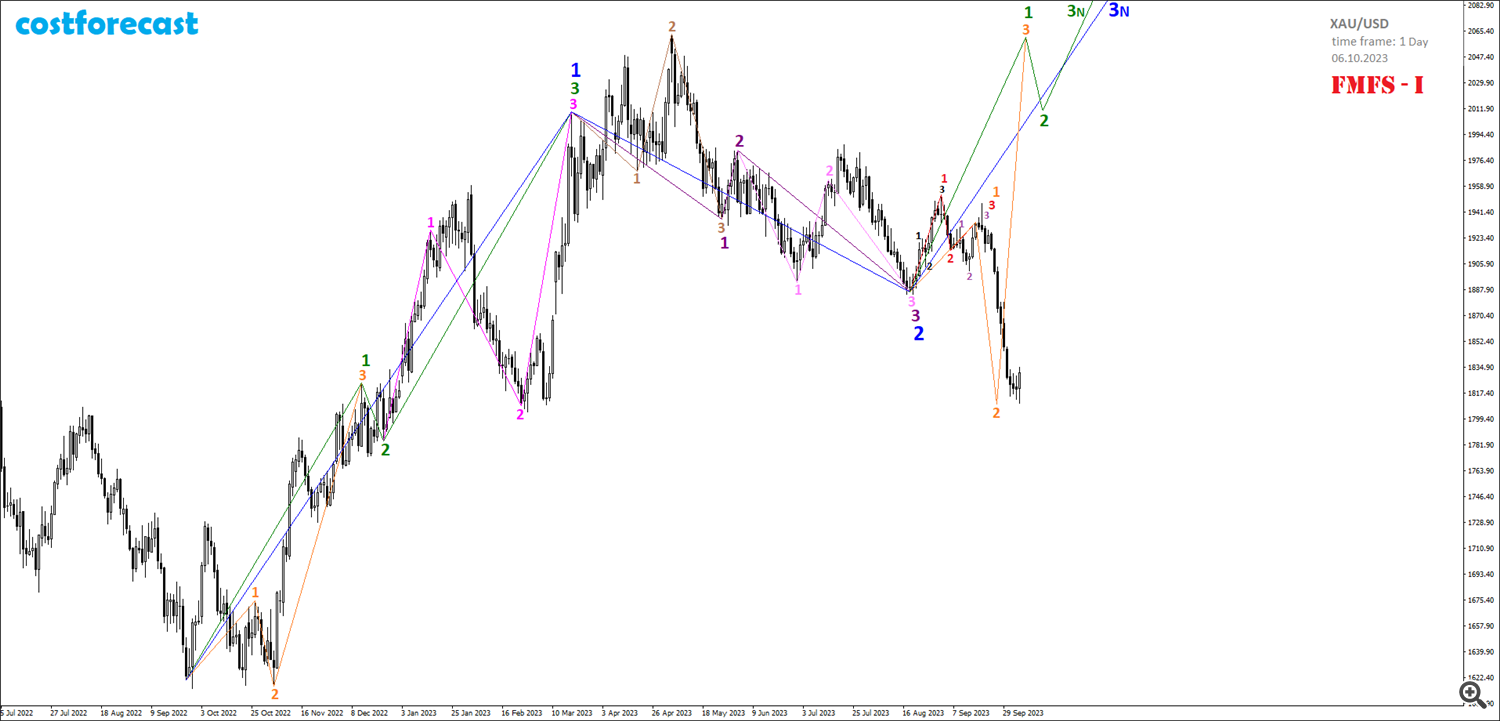
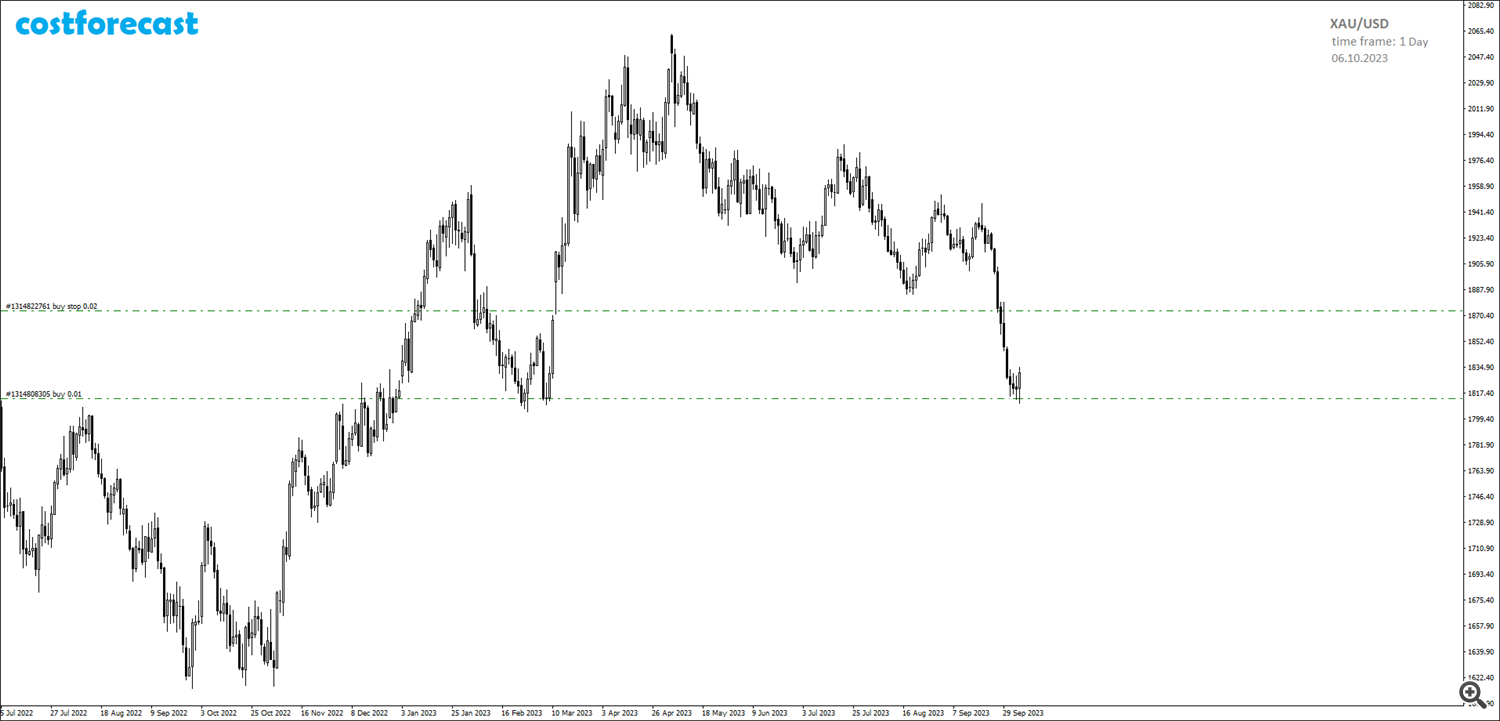
10/06/2023 after the completion of the 2nd segment of the orange fractal at the calculated point determined by analyzing the smallest fractal structures of charts with minute time frames, a long position in gold was opened with a volume of 0.01 lot at a price of $1,813.56 per troy ounce (Fig. 1-5).
The closing of the daily candle on 10/06/2023 above the market entry point gives reason to assume that the chosen model is correct for the future dynamics of gold prices according to the FMFS-I scenario (Fig. 1-5).
In anticipation of an explosive growth in gold prices, it was decided to add a pending buy stop order with a volume of 0.02 lots at $1,873.56 per ounce in addition to the open long position (Fig. 1-6).
More to come.
Read all Diary entries on the costforecast website at the link: https://costforecast.bitrix24.site/blog1-2-en/

