Technical Analysis for US Dollar, S&P 500, Gold and Crude Oil - Waiting for Direction Cues Within Familiar Range for S&P 500

US DOLLAR TECHNICAL ANALYSIS
Prices transitioned into digestion
mode after bouncing to retest a recently broken rising trend. A daily
close above the 23.6% Fibonacci expansion at 12027 exposes the trend
line support-turned-resistance at 12058.

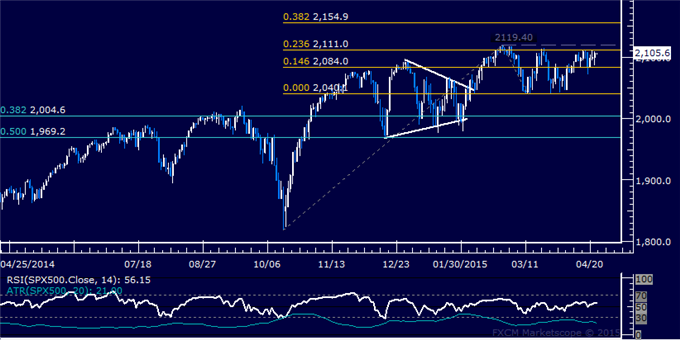
S&P 500 TECHNICAL ANALYSIS
Prices continue to hover below
resistance in the 2111.00-19.40 area (23.6% Fibonacci expansion,
February 25 high). A break above that on a daily closing basis exposing
the 38.2% level at 2154.90.
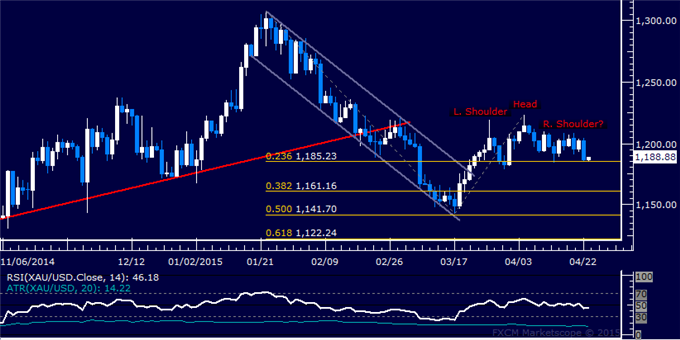
GOLD TECHNICAL ANALYSIS
Prices may be carving out a bearish
Head and Shoulders top chart pattern. Confirmation is required on a
daily close below 1185.23, the 23.6% Fibonacci expansion, with the first
downside target thereafter coming in the 38.2% level (1161.16).
Near-term resistance is at 1224.15, the April 6 high.
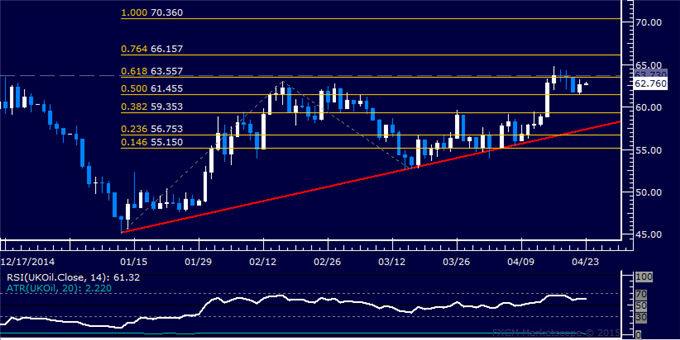
CRUDE OIL TECHNICAL ANALYSIS
Prices transitioned back into
consolidation mode after recoiling lower from resistance near the
$65/barrel figure. A break below the 50% Fibonacci expansion at 61.46
exposes the 38.2% level at 59.35. Alternatively, a move above the
63.56-73 area (61.8% Fib, April 16 close) targets the 76.4% expansion at
66.16.