
Simultaneous Displaying of the Signals of Several Indicators from the Four Timeframes

Introduction
While manual trading you have to keep an eye on the values of several indicators. It is a little bit different from mechanical trading. If you have two or three indicators and you have chosen a one timeframe for trading, it is not a complicated task. But what will you do if you have five or six indicators and your trading strategy requires considering the signals on the several timeframes? Moreover, what will happen, if you trade simultaneously with several currency pairs? The task seems to be complicated enough and in most of cases it leads to mistakes and therefore, to losses.
Real_Time_MultiIndicator_v1 is specially created for solving these tasks. This indicator
calculates the signals of the chosen indicators on the four timeframes simultaneously
and converts them into one table in the subwindow of the main chart. In the brackets
after the signal of the indicator you can see the number of the last bars belonging
to the chosen timeframe, which demonstrate the signal.
You can change the parameters of the indicators and to add your own indicators.
Now in order to make a decision you only have to take a look at the table where
the signals from the four timeframes are collected.
Real_Time_MultiIndicator_v1
The indicator displays the data in the separate subwindow of the chart. This is the indicator’s external view:
Please pay attention that the average price (High+Low)/2 is used for all indicators. It can be different from the default values. If you attach the indicator to the chart or if you change the zoom of the main chart, the table with the data can spread or shrink. Don’t be confused. The table will take a normal view after the new tick will come. If the terminal is not connected to Internet, do the following after the zooming of the chart: change the timeframe, e.g. H1 to H4 and vice versa, and the table will take a normal view.
To use the indicator you have to download Real_Time_MultiIndicator_v1.mq4 file into the \ folder with the terminal\experts\indicators
and to reboot the terminal. For attaching the indicator choose the “User’s indicators” section in the “Navigator”,
then go to the Real_Time_MultiIndicator_v1. Then in the menu
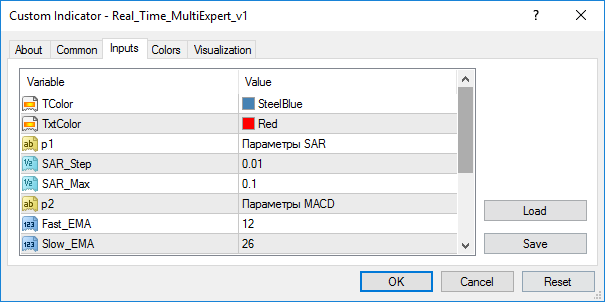
You can choose the color of the table (TColor), the color of the text (TxtColor), and also the parameters of the
indicators being used. If you want to change the parameters of the indicators, you have to do the following:
right-click the main chart and choose the “List of indicators” command or use Ctrl+I buttons,
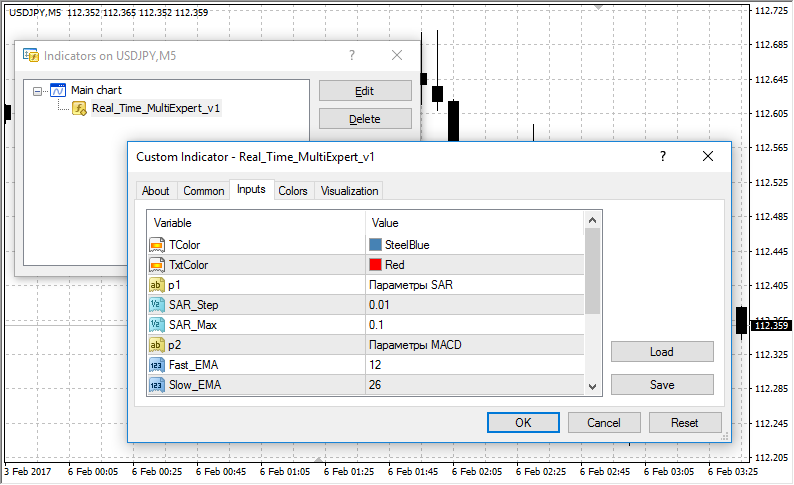
then choose Real_Time_MultiIndicator_v1 and click the “Properties” button. The change of the parameters of
the indicators is not very difficult, while the adding of a new indicator will take some effort and knowledge
of MQL4 on the entry level.
Adding a New Indicator in the Table
I haven’t filled the last three lines of the indicator table so that you could add the indicators you use or the ones you have written yourself. I tried to make the algorithm of calculation and conversion the data into the table as easy as possible. Moreover, I left the pieces of the code with the comments in the source program so that anyone who knows MQL4 on the entry level could add the indicators into the table without delving into the details of the functioning of the algorithm.
Using the example of the Commodity Channel Index indicator, I will show you the
algorithm for adding a new indicator into the table. Please pay attention that
I will interpret the signals of this indicator in the following way: the indicator
value 0 - the signal to buy, and vice versa. This interpretation is a little bit
different from the classic one, but I do it on purpose in order to make the explanation
of the algorithm easier. Further you can interpret the signals at your own convenience.
Choose the "User's indicators" section in the "Navigator", then go to the Real_Time_MultiIndicator_v1
and click the “Change” button.
Then we will make changes in the source code:
//----The parameters of the indicators
extern string p1 = "SAR parameters";
extern double SAR_Step = 0.01;
extern double SAR_Max = 0.1;
extern string p2 = "MACD parameters";
extern int Fast_EMA = 12;
extern int Slow_EMA = 26;
extern int MACD_SMA = 9;
extern string p3 = "Moving Average parameters";
extern int Fast_MA = 5;
extern int Slow_MA = 10;
extern string p4 = "ADX parameters";
extern int ADX_Period = 14;
//extern string p5 = "The parameters of the indicator 1";
//extern string p6 = "The parameters of the indicator 2";
//extern string p7 = "The parameters of the indicator 3";
In this piece you have to delete the comments in the line with the text “The parameters of the indicator 1” and to add the CCI name. As a result you will have:
extern string p5 = "CCI parameters";
Then add the parameter of the CCI indicator – the period:
extern string p5 = "CCI parameters";
extern int Period_CCI = 14;
In this line
string name[] = {"Parabolic SAR","MACD","Сrossing MA","ADX","","",""};
add the name of the indicator for displaying in the table:
string name[] = {"Parabolic SAR","MACD","Сrossing MA","ADX","CCI","",""};
Then in the indicator initialization block
  int init()
    {
     string sn = "Real_Time_MultiIndicator_v1";
     IndicatorShortName(sn);
     SetIndexLabel(0, sn);
     name[0] = name[0] + "(" + DoubleToStr(SAR_Step, 2) + ", " +
               DoubleToStr(SAR_Max, 2) + ")";
     name[1] = name[1] + "(" + DoubleToStr(Fast_EMA, 0) + ", " +
               DoubleToStr(Slow_EMA, 0) + ", " +
               DoubleToStr(MACD_SMA, 0) + ")";
     name[2] = name[2] + "(" + DoubleToStr(Fast_MA, 0) + ", " +
               DoubleToStr(Slow_MA, 0) + ")";
     name[3] = name[3] + "(" + DoubleToStr(ADX_Period, 0) + ")";
     //name[4] = name[4] + "(" +
     //          DoubleToStr(1st parameter of the indicator 1, 0) +
     //          ", " + DoubleToStr(2nd parameter of the indicator 1, 0) + ")";
     //name[5] = name[5] + "(" +
     //          DoubleToStr(1st parameter of the indicator 2, 0) +
     //          ", " + DoubleToStr(2nd parameter of the indicator 2, 0) + ")";
     //name[6] = name[6] + "(" +
     //          DoubleToStr(1st parameter of the indicator 3, 0) +
     //          ", " + DoubleToStr(2nd parameter of the indicator 3, 0) + ")";
     return(0);
    }
we delete the comments in the line
//name[4] = name[4] + "(" +

//          DoubleToStr(1st paramater of the indicator 1, 0) +

//          ", " + DoubleToStr(2nd parameter of the indicator 1, 0) + ")";
and make the following changes:
name[4] = name[4] + "(" + DoubleToStr(Period_CCI, 0) + ")";
Then delete the comments from this block:
/*
//+------------------------------------------------------------------+
//| Function 1                                                       |
//+------------------------------------------------------------------+

string Function(int p)

 {
  int ii  = 1;
  if (C=Condition for the indicator - true - sell, false - buy)
    {
      while (Conditionc for sell)
          ii++;
      if (Error(p,ii+1) == 1) return("Waiting data");
      return("Sell(" + DoubleToStr(ii, 0) + ")");
    }
  else
    {
      while (Condition for buy)
          ii++;
      if (Error(p,ii+1) == 1) return("Waiting data");
      return("Buy(" + DoubleToStr(ii, 0) + ")");
    }
  }*/
Instead of the word “Function” write the name of the function, e.g. CCI:
string CCI(int p)
Now instead of “Condition for the indicator - true - sell, false – buy” line write the condition for the
signal to buy for the current (zero) bar:
iCCI(NULL, p, Period_CCI, PRICE_MEDIAN, 0) < 0
Then, instead of the line "Condition for sell” write the condition for the signal to buy and for the calculating
the number of the processed bars demonstrating this signal:
while(iCCI(NULL, p, Period_CCI, PRICE_MEDIAN, ii) < 0)
ii—is a shift in reference to the current bar. In the same way change the line "while" (Condition
for buy) to
while(iCCI(NULL, p, Period_CCI, PRICE_MEDIAN, ii) > 0)
As a result we see:
string CCI(int p)
  {
    int ii = 1;
    if(iCCI(NULL, p, Period_CCI, PRICE_MEDIAN, 0) < 0)
     {
       while(iCCI(NULL, p, Period_CCI, PRICE_MEDIAN, ii) < 0)
ii++;
      if(Error(p, ii + 1) == 1)
          return("Waiting data");
      return("Sell(" + DoubleToStr(ii, 0) + ")");
    }
  else
    {
      while(iCCI(NULL, p, Period_CCI, PRICE_MEDIAN, ii) > 0)
          ii++;
      if(Error(p, ii + 1) == 1)
          return("Waiting data");
      return("Buy(" + DoubleToStr(ii, 0) + ")");
    }
  }
If you want to count the signals from the 100 and -100 levels, and not to interpret the range (-100;100) as a signal to buy or to sell, you have to change 0 to -100 and 100 for sell and buy respectively and to add the next line for displaying the uncertainty fact in the table:
if(iCCI(NULL, p, Period_CCI, PRICE_MEDIAN, 0) > -100) &&
iCCI(NULL, p, Period_CCI, PRICE_MEDIAN, 0) < 100))
    return("N/A");
Now we have:
string CCI(int p)
   {
int ii = 1;
    if((iCCI(NULL, p, Period_CCI, PRICE_MEDIAN, 0) > -100) &&
       (iCCI(NULL, p, Period_CCI, PRICE_MEDIAN, 0) < 100) )
        return("N/A");
    if(iCCI(NULL, p, Period_CCI, PRICE_MEDIAN, 0) < -100)
      {
        while(iCCI(NULL, p, Period_CCI, PRICE_MEDIAN, ii) < -100)
            ii++;
        if(Error(p, ii + 1) == 1)
            return("Waiting data");
        return("Sell(" + DoubleToStr(ii, 0) + ")");
      }
    else
      {
        while(iCCI(NULL, p, Period_CCI, PRICE_MEDIAN, ii) > 100)
            ii++;
        if(Error(p, ii + 1) == 1)
            return("Waiting data");
        return("Buy(" + DoubleToStr(ii, 0) + ")");
      }
   }
Now we have to convert the results of the calculation into the table. We do the
following: find the piece of the code in the text of the program
/*//----------Fifth line
  for (i = 1; i <= 4; i++)
     {
       ObjectDelete("6" + DoubleToStr(i, 0));
       ObjectCreate("6" + DoubleToStr(i, 0), OBJ_TEXT,
                           WindowFind("Real_Time_MultiIndicator_v1"), textT[i+1], textC[6]);
       ObjectSetText("6" + DoubleToStr(i, 0), Функция(per[i-1]), 13, "Tahoma", TxtColor);
    }*/
and delete the comments from it. As the coordinates for displaying the text are calculated separately, it makes
possible to fill the table using the cycle. You have to set the function which calculates the results. Then write
the name of the function instead of the word “Function”. Now we have:
 //----------Fifth line
 for (i=1;i<=4;i++)
   {
     ObjectDelete("6" + DoubleToStr(i, 0));
     ObjectCreate("6" + DoubleToStr(i, 0), OBJ_TEXT,
                  WindowFind("Real_Time_MultiIndicator_v1"),
                  textT[i+1], textC[5]);
     ObjectSetText("6" + DoubleToStr(i, 0), CCI(per[i-1]), 13,
                   "Tahoma", TxtColor);
   }
Then click the “Compile” button. Go to the terminal and attach the indicator to the chart. As a result we
have:
If you want to change the timeframes where the values of the indicators are counted,
you have to do the following:
In the line:
int per[] = {15,30,60,240};
enter the quantity of the minutes for the timeframe you have chosen, e.g.:
int per[] = {5,30,60,240};and in the line:
string nameS[] = {"INDICATOR","M15","M30","H1","H4"}
you have to enter its name:
string nameS[] = {"INDICATOR","M5","M30","H1","H4"};
and to compile. Finally we have:
Debugging the Parameters on History
The described indicator can be used only in online mode. The reason for it is that
while the testing in visualization mode the indicator will show the adequate values
on the current timeframe only. It is the feature of the terminal and the tester.
If you want to debug the parameters of the indicators or to test your own strategy
when testing visualization on history, I suggest that you should use Real_Time_MultiExpert_v1.
The functions performed by Real_Time_MultiIndicator_v1 and Real_Time_MultiExpert_v1
are absolutely identical. Their source code is identical, and making changes into
the code of the expert has the same algorithm as making changes in the code of
the indicator. For using the expert you have to download the Real_Time_MultiExpert_v1.
mq4 file into the \terminal folder\experts\indicators and to reboot the terminal.
To use Real_Time_MultiExpert_v1 you have to make a template with the “Real_Time_MultiExpert_v1” name with
the indicator “Real_Time_MultiIndicator_v2” attached to the chart. The task of the “Real_Time_MultiIndicator_v2”
indicator is to make a subwindow with the zooming under the main chart. Then you have to select the Real_Time_MultiExpert_v1
in the “Advisor” field of the tester and to select the “All ticks” option in the “Model” field, otherwise
the indications of the advisor on the current (zero) bar can be different from real state of things, but in the
whole the indications will be correct.
Don’t forget to click the automatic shift button:
Then choose the "Visualization" option and click the "Start" button.
In the Real_Time_MultiIndicator_v2 window you will see the table with the signals
of the indicators. You can choose any timeframe for testing, as the values of the
indicators do not depend on it. There is no big difference between the described
expert and the indicator, so you can choose what you like. In my opinion it is
more convenient to use the indicator in online mode.
Conclusion
In the article we discussed one of the methods of collecting and organizing the important information on the condition of the market, -the signals of the several indicators from the four timeframes. This method can be used for solving a wide range of tasks. Using the described programs you can select the necessary parameters for the indicators you use when testing on history quotes. The indicator is aimed to be used for manual trading.
Translated from Russian by MetaQuotes Ltd.
Original article: https://www.mql5.com/ru/articles/1461
 Alternative Log File with the Use of HTML and CSS

 Ten "Errors" of a Newcomer in Trading?
 Displaying of Support/Resistance Levels
- Free trading apps
- Over 8,000 signals for copying
- Economic news for exploring financial markets
You agree to website policy and terms of use
Sir,
I am from India.
Your real time indicator is very useful. i want to display the current ParabolicSAR value for different time frame in the tabulated column.
is it possible. Kindly update the program and forward to me
Ravichandran.
email- chandranmail@yahoo.com