Join our fan page

- Views:
- 8197
- Rating:
- Published:
- 2019.04.06 21:10
- Updated:
- 2022.03.12 19:21
-
 You are missing trading opportunities:
- Free trading apps
- Over 8,000 signals for copying
- Economic news for exploring financial markets
Registration Log inYou agree to website policy and terms of use
If you do not have an account, please register
-
 Need a robot or indicator based on this code? Order it on Freelance
Go to Freelance
Need a robot or indicator based on this code? Order it on Freelance
Go to Freelance
Description:
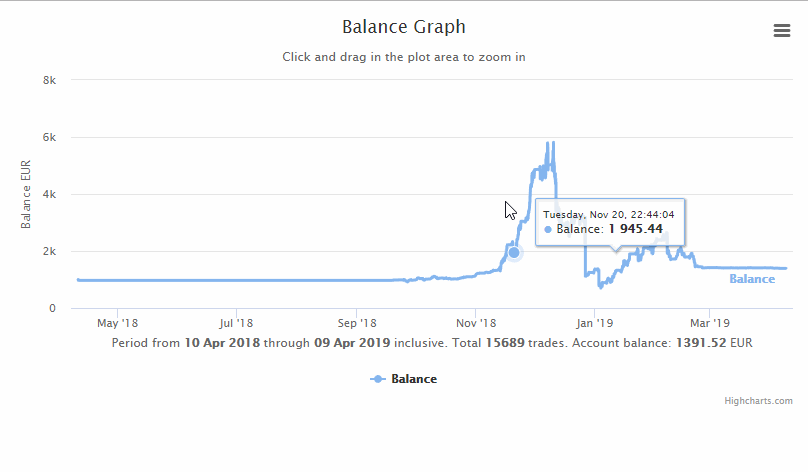
Display interactive HTML graph of the account balance inside the web browser.
The included template html file uses the HighCharts JavaScript library from https://www.highcharts.com/
Highcharts makes it easy for developers to set up interactive charts in their web pages.
Make your data come alive
Updated Highcharts JS v10.0.0 (2022-03-07)
How to use:
- Copy the files to the \Scripts folder
- Compile and run the script 'Graph_test.mq5'
- The web page should be displayed in your web browser.
The generated html file can be located at "%userprofile%\AppData\Roaming\MetaQuotes\Terminal\Common\Files\Graph.htm"
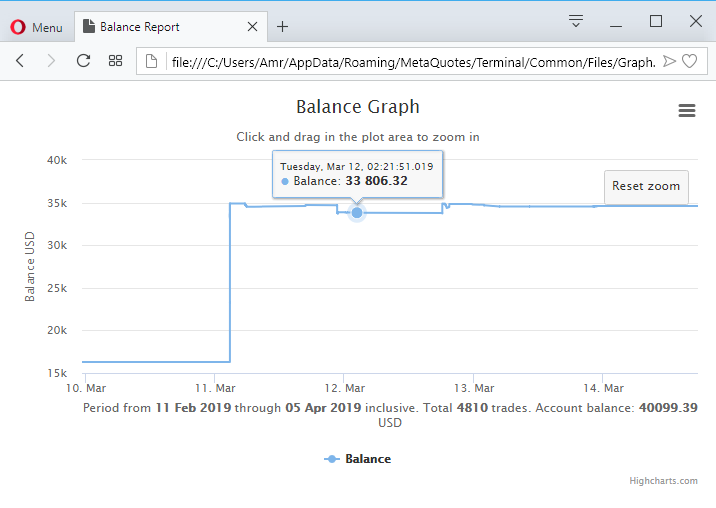
Tooltips showing the balance
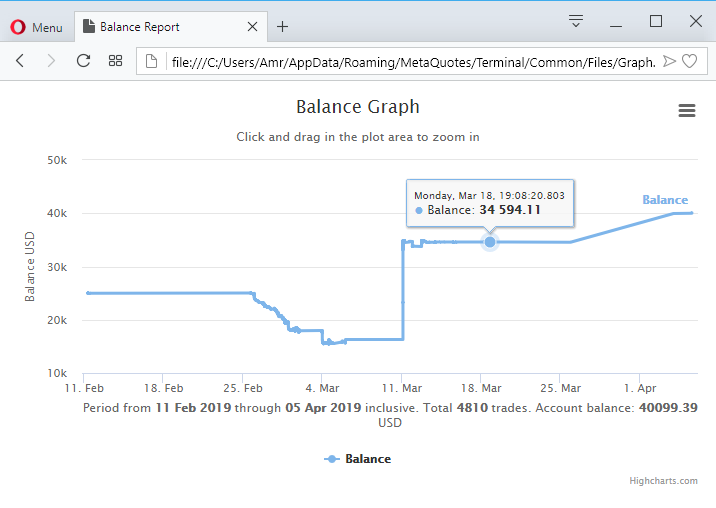
Zoom at specific points
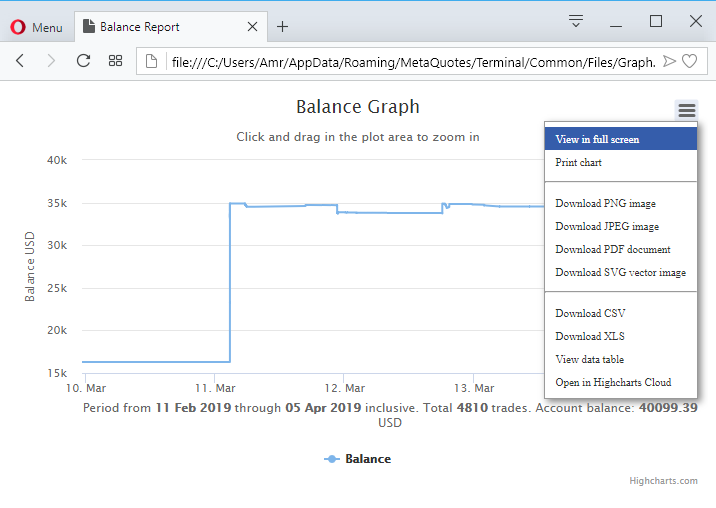
Other features:
 Pan PrizMA Sin leverage 72
Builds a sliding line with a polynomial of 4 degrees. Extrapolates as a section of a given function with a sinusoid and its axial one. One value is taken from the constructed lines on each bar and a line of extrapolated values is plotted, which does not redraw.
 MQL_Easy
A cross platform library/framework
CPairedDealInfo Class
A class to reconstruct closed trades (paired in/out deals) from history sorted by close time.
 Lavika EURGBP/EURUSD
The Expert Advisor uses four iMA (Moving Average, MA) indicators from two timeframes. Two indicators with averaging periods 1 and 8 are created on the H1 timeframe and two indicators with averaging periods 1 and 8 are also created on the H4 timeframe.