Join our fan page
- Views:
- 9396
- Rating:
- Published:
- 2018.09.27 16:13
-
 You are missing trading opportunities:
- Free trading apps
- Over 8,000 signals for copying
- Economic news for exploring financial markets
Registration Log inYou agree to website policy and terms of use
If you do not have an account, please register
-
 Need a robot or indicator based on this code? Order it on Freelance
Go to Freelance
Need a robot or indicator based on this code? Order it on Freelance
Go to Freelance
The Wyckoff PriceVolume Histogram oscillator indicator allows analyzing the market by applying Richard Wyckoff's volume spread analysis VSA.
Here the "spread" does not mean Ask-Bid, but the full size of the candle: High-Low.
The indicator has three input parameters:
- Fast period - fast smoothing period
- Slow period - slow smoothing period
- Show histogram - show the histogram
First, the candlestick "profile" is calculated. Then, based on the obtained profile, the candlestick's "volume weight" is calculated, and then the histogram value is calculated by subtracting the past candlestick profile from the current profile.
To draw the average values, two SMAs with different periods are calculated - fast and slow - based on the candlestick profiles.
If Show histogram = Yes, an additional histogram is drawn showing the differences between the past and current profiles.
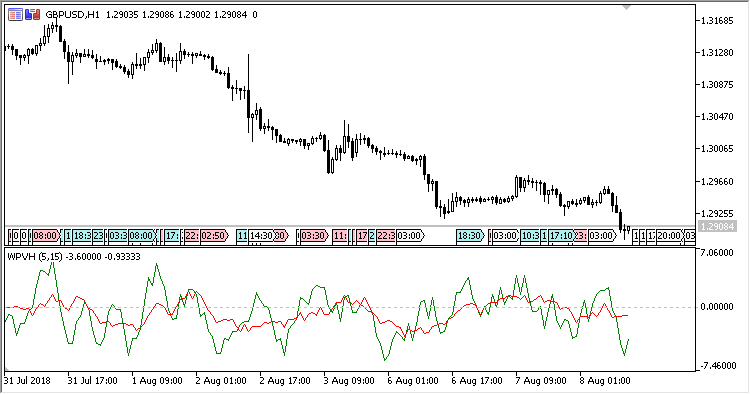
Fig. 1. Show histogram = No
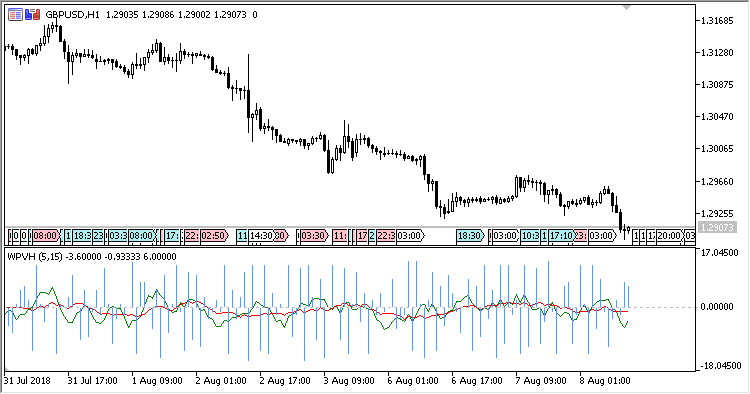
Fig. 2. Show histogram = Yes
,
Translated from Russian by MetaQuotes Ltd.
Original code: https://www.mql5.com/ru/code/21858
 Volatility_Arbitrage
The Volatility Arbitrage indicator
Valid_Swing_HighLow
The Valid Swing HighLow indicator
RSI_Histogram_Vol_HTF
The RSI_Histogram_Vol indicator with the ability to change the timeframe using input parameters.
 Market Capture
A scalping Expert Advisor based on the "Market Capture" strategy.