To the world conspiracy plotters and complete paranoiacs, or simply those who like to control the price, you are welcome! ;)

It's elegant... It's a mistake not to go to the left - it spoils the overall impression.
Weesh! Keep it up.
Rename the branch to "Forex-Directorate", we'll put all sorts of bullshit software here. It'll come in handy.
// No kidding. Multicurrency is next.
;)
sanyooooook, do you know how to draw piecewise line graphs on a chart?
Of course, chart points can be anywhere, not just at points in time corresponding to bars. What method can you suggest?
Till now I see nothing more beautiful than labels with numerous dots. Well, it could be thousands of objects... the processor would burn out, poor thing...
The idea is this: I want to show on the chart a graph of paper profit on open positions (total profit).
P.S. "Five" is not a suggestion.
P.P.S. Drawn, there are little things left (vertical scale with numbers) and the grid. Yes and the processor is not on fire.
Here - about 13 thousand objects (dots), drawn in 110 ms. It's pale because the drawing is already scaled.
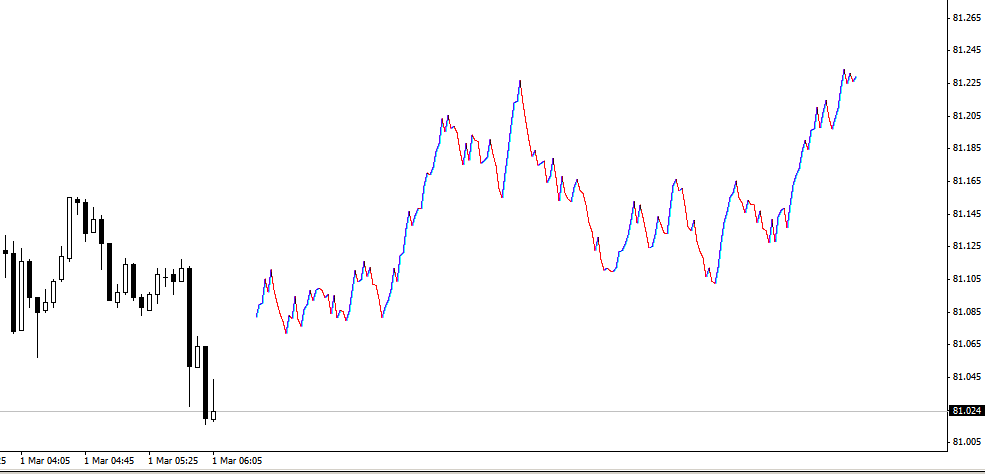
Just looking at the value of equti on the chart?
find the lines in the Isc_Bar text^
   double Bid_=GlobalVariableGet("TICK");//------------------
//-------------------------------------
...
...
//---------------------
        if(GlobalVariableGet("TICK")==Bid_)//------------------
        {
           Sleep(1);
           continue;
        }
   Bid_=GlobalVariableGet("TICK");//--------------------------
TickInBar=1;
Replace the global variable with the value you need, and you'll get the tick chart you need.
ZS: that's if I understand you correctly.
Weesh! Keep it up.
Rename the branch to "Forex-Directorate", we'll put all sorts of bullshit software here. It'll come in handy.
// No kidding. Multicurrency is next.
;)
), well, a multi-currency unit of 3 pairs can still be created, I don't think I have enough imagination for now), and the CPU is strong enough
Almost right. I really don't need every tick. The chart update goes... well, let's say every 100 ticks (about once a minute). But paper profit data is written to an array, for example, every 10 ticks.
After 100 ticks, 10 values of paper profit are written to the array. And it is these 10 points (together with the points between them, so that the chart is continuous) that should be added to the chart to update it. I.e. to optimize the use of CPU resources, not to delete tens of thousands of labels each time and draw again, but to add only new labels (hundreds of labels at most).
Where is this Isc_Bar?
Where is this Isc_Bar?
In the archive above.
- Free trading apps
- Over 8,000 signals for copying
- Economic news for exploring financial markets
You agree to website policy and terms of use
1. First, create two variables "THIGH" value 110000, "TLOW" value 90000 in the global variables of the terminal.
2. Run the TICK script on any chart.
At any other chart launch Isc_Bar.
4. Menu->File->Open Offline. Open a chart with an exclamation mark (!EURUSD100).
4.5 Let's wait for the history (1-2 minutes).
5. On the open standalone chart, draw 2 trend lines with the names "TH", "TL".
6. We launch the Create_Trend script.
7. Move the lines as we want and move the price wherever we want. (The price will not go left).