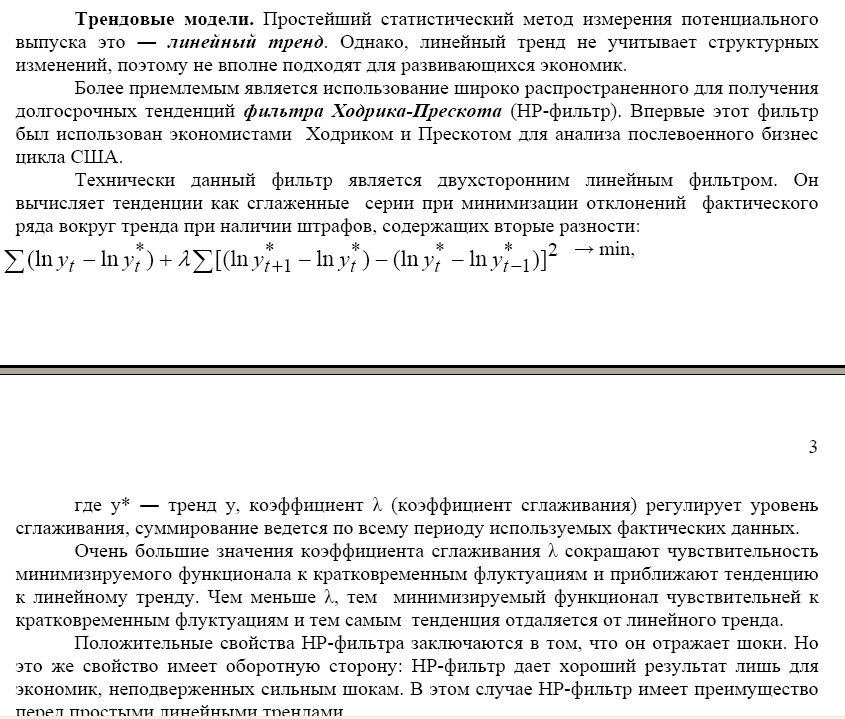
Hodrick-Prescott filter
I don't see a lag in the muving. It means that the author does not understand what he has set, or there is an error in the algorithm and the indicator redraws.
There is no lag, because it is not a muwink in general. The problem of minimizing the function for a given series is solved. Of course when the series is moving, if the length of the series is small, it will redraw when new information appears, especially if there are spikes. Description of the filter at http://en.wikipedia.org/wiki/Hodrick-Prescott_filter
In principle, this function is in MATLAB, if I'm not mistaken, it can be made into a DLL using the Matlab compiler. Accordingly, create an indicator that would address this Dll.
I think the world is simpler than with a dll.
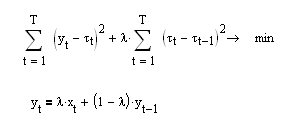
Here is the function that we need to minimize to build this digital filter:
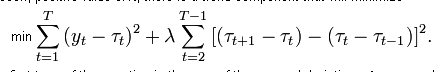
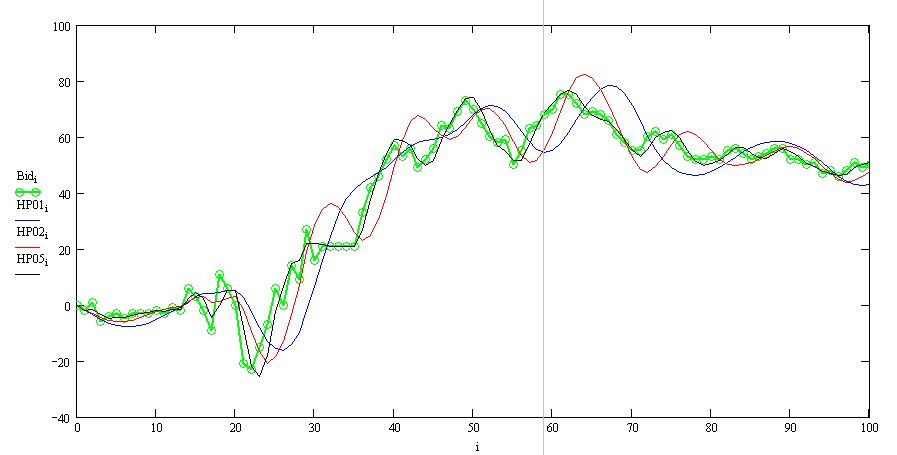
We can see that in this formulation the filter can only work on historical data, since in order to calculate the trend line value at the current time we need to know not only the previous values of this trend but also one step ahead t[i+1]. Such a filter will, on the history, show the exact coincidence of the smooth curve with the kotir (this is what the author cited in the first post as a demonstration), while at the right border of the kotir there will be an unbelievable overdrawing.
Here's what else I dug up on the web:
I couldn't find any ready-made recipe for building this filter. Actually, let's take and build a functional for the right edge of BP by ourselves (upper equation).
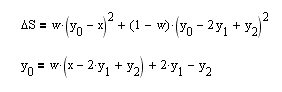
Let's take a derivative of it by the parameter y[0] - current value and equate it to zero, and immediately get a recurrent expression for the required HP-filter (lower equation). Let us see how the smoothing properties of the filter depend on the smoothing parameter w:
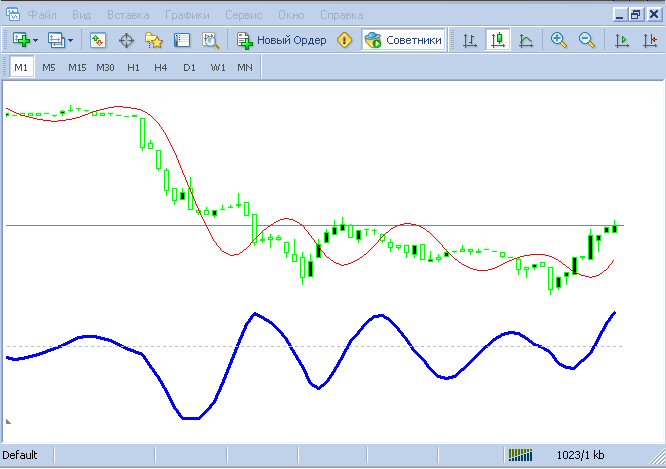
Here, the green line is cotier, the black line is w=0.5, etc. You can see that everything works properly - there is an inevitable phase delay that is bigger the stronger antialiasing and the right edge is not redrawn. Now we can code it in MQL as well.
//+------------------------------------------------------------------+
//| Moving Average HP.mq4 |
//| Code by Neutron |
//+------------------------------------------------------------------+
#property indicator_chart_window
#property indicator_color1 Blue
#property indicator_width1 3
extern double w=0.1;
int Start,i,m;
double MA[5000],Y[5000];
int start()
{
Start=5000;
MA[Start]=Open[Start];
MA[Start-1]=Open[Start-1];
for (i=Start-2;i>=0;i--) MA[i]=w*(Open[i]-2.*MA[i+1]+MA[i+2])+2.*MA[i+1]-MA[i+2];
}
int init()
{
SetIndexStyle(0,DRAW_LINE);
SetIndexBuffer(0,MA);
return(0);
}
Here's how it turned out:
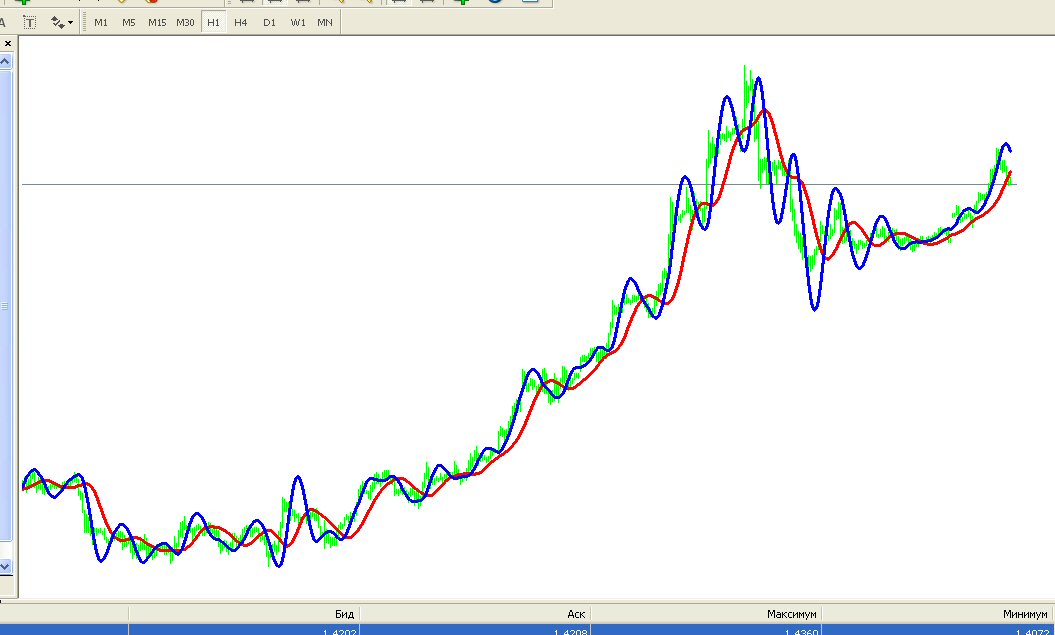
Blue is HP, green is cotier, red is a 2nd order Watterout filter (for comparison).
Indeed, this filter tries to catch linear trends honestly. Look at the functionality at the top of the post - it shows that in addition to minimizing the muving deviation from the kotir (first sum), there is a requirement to minimize the second derivative (second sum)! And after all, the second derivative of the line is zero, and the requirement to minimize it is equal to the requirement to maximize the aspiration to the trend line for an arbitrary input vector of data. I liked the approach.
P.S. It's interesting, if in the expression for the functional we require minimization of the first derivative (upper equation) instead of the second one, we get a recurrence formula for the EMA exponential average (lower equation):
It turns out that the exponential average is the smoothest of all possible muvings!
It turns out that the exponential average is the smoothest of all possible muwings
Yes, there is an article on the subject.
Haven't done on the article, but by developing the same idea of ema smoothness you can get good smoothness:
Blue - EMA15 with a lag of 5.
Red - smoother MA with the same lag.
red =1600
blue =100
yellow = EMA 14, cloze.
- Free trading apps
- Over 8,000 signals for copying
- Economic news for exploring financial markets
You agree to website policy and terms of use
Hello, dear programmers!
Who will undertake to solve, I think, a simple task of writing an indicator? I need to write an indicator that would filter the series with Hodrick-Prescott filter. The function is available in MATLAB, if I'm not mistaken, it can be made into a DLL using MATLAB compiler. Accordingly, we need to create an indicator, which would address to this Dll. At the input we should feed the following parameters - series length, smoothing parameter. The output is a trend component (to be drawn on the chart) and a cyclic component (oscillator).
I cannot do it myself; I don't know MATLAB Compiler and MQL4.
I have a decomposition for Eurodollar H4 on the chart. As seen almost throughout the history, the peculiarity of price movement was that after breaching the trend, the price moved to a distance equal to the difference between the previous extremum and the trend, in short, the amplitude was almost the same. The exception is the latest data, but it is extreme there. Basically, such an indicator should re-draw if the number of data points is small; however if they are increased, say, up to 2000, problems with re-drawing will not arise.